Since the Liberation Day Tariffs on April 7th, Ethereum ( ETH) has rallied over +257%, peaking in late August before entering a consolidation phase. The structure of this chart has shifted multiple times throughout the year, each time forming new continuation and reversal patterns that have defined the broader trend.
Pattern Evolution
1️⃣ Diamond Continuation (May – July)
Between May and July,ETH printed a Diamond formation, which often behaves similarly to a symmetrical triangle. The breakout from this pattern came with high volume participation, fueling a sharp rally into late August.
2️⃣ Descending Triangle Breakdown (August – October)
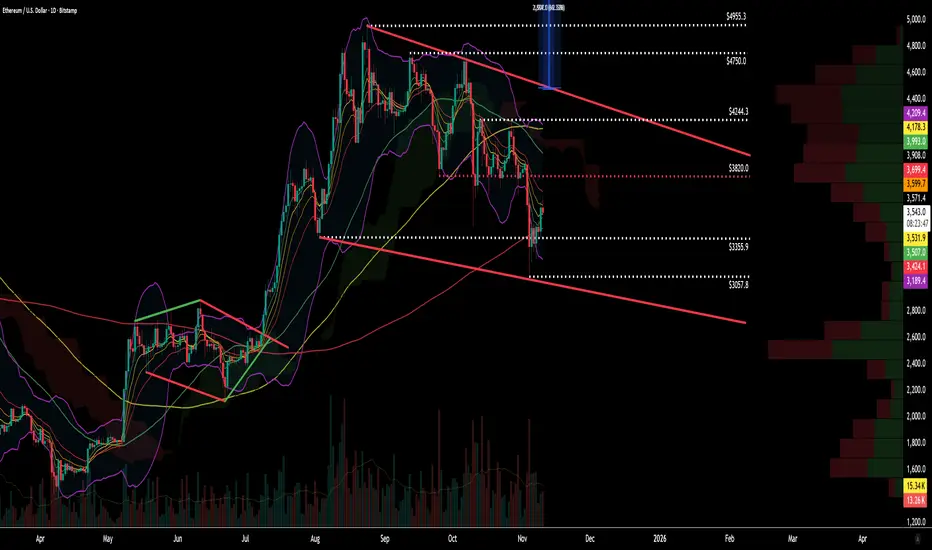
From August through late October, the trend shifted. A Descending Triangle formed, breaking below key support around $3,820.
However, the breakdown failed to achieve its full 1:1 measured move target at $2,675, instead reversing after setting a new low confirmed by a significant volume spike — the highest in nearly a month.
3️⃣ Emerging Bull Flag (August – November)
Since early November, the chart has morphed into a large Bull Flag, encapsulating the entire consolidation since August.
This structure includes multiple resistance layers above, but the consolidation is tightening and volume contracting, typically a precursor to a major breakout attempt.
The measured move projections of both the flagpole and the flag itself point to a substantial upside once price escapes the channel.
Key Resistance & Support Levels
Resistance:
$3,820: Former Descending Triangle support, now acting as resistance
$4,244–$4,245: Major confluence zone at prior swing highs
$4,750: Upper extension of the flag structure
$4,955: August rally high
Support:
$3,356–$3,355: Mid-flag support / prior reaction level
$3,058–$3,057: Lower flag support / key technical base
Technical Summary
✅ Pattern: Diamond → Descending Triangle → Bull Flag
✅ Trend: Broad uptrend consolidating within flag formation
📊 Key Resistance Zones: $3,820 → $4,245 → $4,750
⚠️ Support Zones: $3,355 → $3,057
🎯 Targets:
• Flag projection: $6,390
• Flagpole projection: $7,309
🔍 Trigger: Break and close above $3,820 with expanding volume for early confirmation
Final Notes
Ethereum remains one of the strongest structural setups in the current crypto cycle — consolidating after a multi-month rally and holding well above its mid-year breakout zone.
The bull flag pattern forming across the August–November range has now become the key structure to watch.
A confirmed breakout above $3,820, accompanied by rising volume and broad market strength, could trigger a measured continuation move toward $6,000+.
Conversely, a rejection at resistance or breakdown below $3,055 would invalidate the flag and risk a retest of the lower trendline near $2,800.
Overall, momentum remains constructive, andETH continues to build a powerful base for potential long-term continuation once the current compression resolves.
For educational and technical analysis purposes only.
Pattern Evolution
1️⃣ Diamond Continuation (May – July)
Between May and July,
2️⃣ Descending Triangle Breakdown (August – October)
From August through late October, the trend shifted. A Descending Triangle formed, breaking below key support around $3,820.
However, the breakdown failed to achieve its full 1:1 measured move target at $2,675, instead reversing after setting a new low confirmed by a significant volume spike — the highest in nearly a month.
3️⃣ Emerging Bull Flag (August – November)
Since early November, the chart has morphed into a large Bull Flag, encapsulating the entire consolidation since August.
This structure includes multiple resistance layers above, but the consolidation is tightening and volume contracting, typically a precursor to a major breakout attempt.
The measured move projections of both the flagpole and the flag itself point to a substantial upside once price escapes the channel.
Key Resistance & Support Levels
Resistance:
$3,820: Former Descending Triangle support, now acting as resistance
$4,244–$4,245: Major confluence zone at prior swing highs
$4,750: Upper extension of the flag structure
$4,955: August rally high
Support:
$3,356–$3,355: Mid-flag support / prior reaction level
$3,058–$3,057: Lower flag support / key technical base
Technical Summary
✅ Pattern: Diamond → Descending Triangle → Bull Flag
✅ Trend: Broad uptrend consolidating within flag formation
📊 Key Resistance Zones: $3,820 → $4,245 → $4,750
⚠️ Support Zones: $3,355 → $3,057
🎯 Targets:
• Flag projection: $6,390
• Flagpole projection: $7,309
🔍 Trigger: Break and close above $3,820 with expanding volume for early confirmation
Final Notes
Ethereum remains one of the strongest structural setups in the current crypto cycle — consolidating after a multi-month rally and holding well above its mid-year breakout zone.
The bull flag pattern forming across the August–November range has now become the key structure to watch.
A confirmed breakout above $3,820, accompanied by rising volume and broad market strength, could trigger a measured continuation move toward $6,000+.
Conversely, a rejection at resistance or breakdown below $3,055 would invalidate the flag and risk a retest of the lower trendline near $2,800.
Overall, momentum remains constructive, and
For educational and technical analysis purposes only.
Disclaimer
The information and publications are not meant to be, and do not constitute, financial, investment, trading, or other types of advice or recommendations supplied or endorsed by TradingView. Read more in the Terms of Use.
Disclaimer
The information and publications are not meant to be, and do not constitute, financial, investment, trading, or other types of advice or recommendations supplied or endorsed by TradingView. Read more in the Terms of Use.