Chart Analysis
Trend
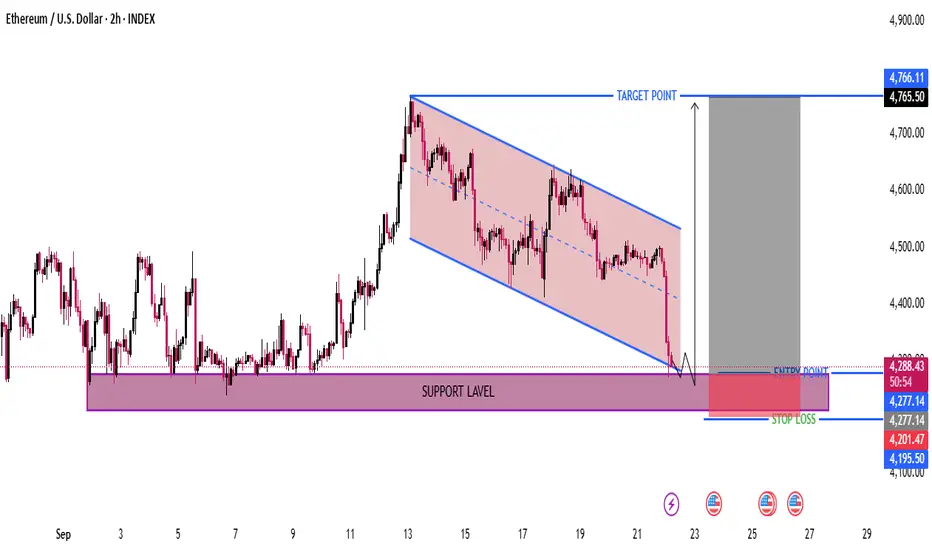
The price has been moving inside a descending channel (marked in red).
Recently, it has reached the lower boundary of the channel, showing potential for a reversal.
Support Level
A strong support zone is highlighted around $4,200 – $4,277 (purple box).
Price has tested this zone multiple times, confirming it as a key demand area.
Entry Zone
The suggested entry point is just above support, around $4,277 – $4,300.
Idea: Wait for bullish confirmation (bounce / reversal candle) before entering.
Stop Loss
Marked below the support zone, around $4,195 – $4,200.
This protects against breakdowns if ETH falls below support.
Target Point
The projected target is $4,765 (top of the channel breakout).
This aligns with the recent swing high before the downtrend began.
📊 Risk-to-Reward (Approximate)
Entry: ~ $4,277
Stop Loss: ~ $4,200 → Risk ~ $77
Target: ~ $4,765 → Reward ~ $488
RR Ratio: ~ 1 : 6.3 (very favorable)
⚠️ Key Notes
Confirmation needed: A strong bullish candle or breakout from the descending channel.
If price breaks below $4,200 support, bearish continuation likely.
Market conditions (BTC movement, macro news) can affect ETH’s reaction.
✅ Overall Setup: This is a bullish reversal setup at major support with high RR. Best strategy → wait for confirmation of bounce before entering long.
Trend
The price has been moving inside a descending channel (marked in red).
Recently, it has reached the lower boundary of the channel, showing potential for a reversal.
Support Level
A strong support zone is highlighted around $4,200 – $4,277 (purple box).
Price has tested this zone multiple times, confirming it as a key demand area.
Entry Zone
The suggested entry point is just above support, around $4,277 – $4,300.
Idea: Wait for bullish confirmation (bounce / reversal candle) before entering.
Stop Loss
Marked below the support zone, around $4,195 – $4,200.
This protects against breakdowns if ETH falls below support.
Target Point
The projected target is $4,765 (top of the channel breakout).
This aligns with the recent swing high before the downtrend began.
📊 Risk-to-Reward (Approximate)
Entry: ~ $4,277
Stop Loss: ~ $4,200 → Risk ~ $77
Target: ~ $4,765 → Reward ~ $488
RR Ratio: ~ 1 : 6.3 (very favorable)
⚠️ Key Notes
Confirmation needed: A strong bullish candle or breakout from the descending channel.
If price breaks below $4,200 support, bearish continuation likely.
Market conditions (BTC movement, macro news) can affect ETH’s reaction.
✅ Overall Setup: This is a bullish reversal setup at major support with high RR. Best strategy → wait for confirmation of bounce before entering long.
Disclaimer
The information and publications are not meant to be, and do not constitute, financial, investment, trading, or other types of advice or recommendations supplied or endorsed by TradingView. Read more in the Terms of Use.
Disclaimer
The information and publications are not meant to be, and do not constitute, financial, investment, trading, or other types of advice or recommendations supplied or endorsed by TradingView. Read more in the Terms of Use.