Welcome everyone,
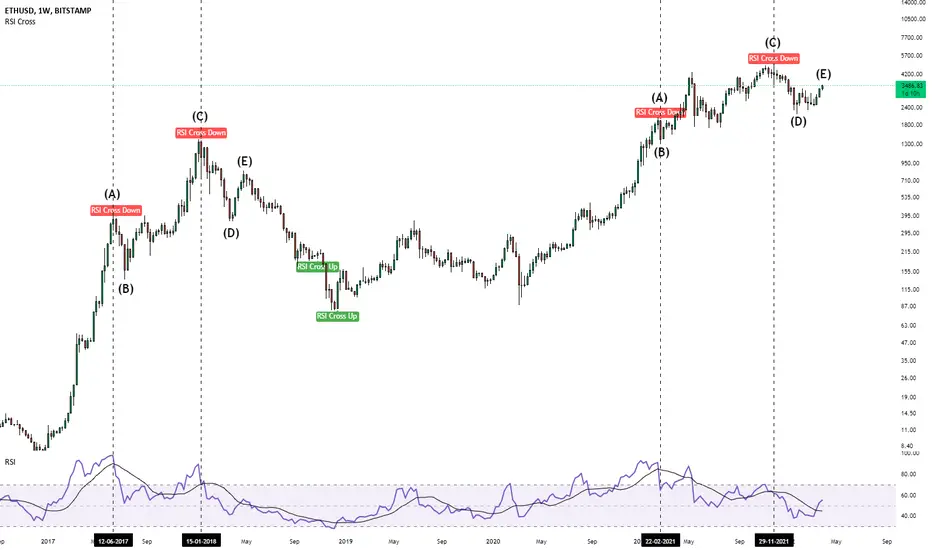
In this chart, you can see two labels:
1. RSI Cross Down
2. RSI Cross UP
When RSI crosses RSI's SMA and RSI < 40, it's Cross UP.
And When RSI crosses RSI's SMA and RSI > 60, it's Cross Down.
In the chart, you can see how the similar pattern has been formed on Ethereum Weekly.
If this is the case again, you can see a drop down from (E) pretty soon.
Let me know what you think about this idea.
Thanks for visiting ;)
Related publications
Disclaimer
The information and publications are not meant to be, and do not constitute, financial, investment, trading, or other types of advice or recommendations supplied or endorsed by TradingView. Read more in the Terms of Use.
Related publications
Disclaimer
The information and publications are not meant to be, and do not constitute, financial, investment, trading, or other types of advice or recommendations supplied or endorsed by TradingView. Read more in the Terms of Use.