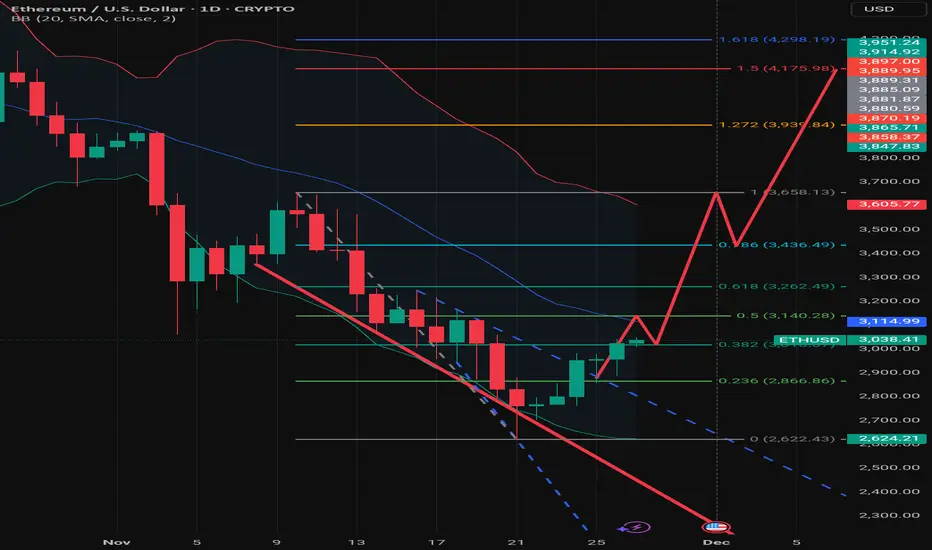
The asset has been in a downtrend (evidenced by the steep drop from the $3,658 high), but it is currently staging a sharp reversal/relief rally.
Fibonacci Retracement Analysis
The chart uses a Fibonacci retracement drawn from the high of ~$3,658 to the low of ~$2,622.
Current Battle (0.382 Level): The price is currently testing the 0.382 Fib level at roughly $3,017. This is a critical zone. Breaking and closing above this level indicates that the recovery is gaining legitimate strength rather than just being a "dead cat bounce."
Immediate Resistance (0.5 Level): If the price sustains above $3,031, the next magnet is the 0.5 Fib level at $3,140.
The Golden Pocket (0.618 Level): The most significant resistance lies at $3,262. Bearish trends often reverse back down from here. A clean break above $3,262 validates a full trend reversal to the upside.
Bollinger Bands (BB)
Mean Reversion: The price had been hugging the Lower Bollinger Band (oversold territory) but has now snapped back up.
The Middle Band (Basis): The red center line (20 SMA) is sitting around $3,114. This aligns closely with the 0.5 Fibonacci level.
Technical Insight: In a downtrend, the Middle Band often acts as dynamic resistance. The price needs to reclaim this line to flip the momentum from bearish to bullish.
Momentum Indicator (Bottom Panel)
Sharp Spike: The Momentum (Mom) indicator shows a very sharp vertical spike to 2.52. This indicates a sudden, aggressive influx of buying volume or volatility. While bullish, such sharp spikes can sometimes precede a short-term cool-off or consolidation as the market digests the move.
Summary of Critical Levels
Level Type Price Significance
Resistance 1 $3,114 - $3,140 Confluence of Middle Bollinger Band and 0.5 Fib.
Resistance 2 $3,262 The 0.618 "Golden Pocket" (Major Pivot).
Resistance 3 $3,658 Previous Swing High.
Support 1 $2,866 The 0.236 Fib level.
Support 2 $2,622 The recent Swing Low (Must hold for bullish case).
Verdict
The chart shows a strong counter-trend rally. The "Red Line" scenario is an optimistic bullish reversal setup (likely an Inverse Head and Shoulders or Elliott Wave 1-2-3).
Caution: Until ETH closes a daily candle above the Middle Bollinger Band ($3,114) and the 0.618 Fib ($3,262), the macro trend technically remains bearish/neutral.
Disclaimer
The information and publications are not meant to be, and do not constitute, financial, investment, trading, or other types of advice or recommendations supplied or endorsed by TradingView. Read more in the Terms of Use.
Disclaimer
The information and publications are not meant to be, and do not constitute, financial, investment, trading, or other types of advice or recommendations supplied or endorsed by TradingView. Read more in the Terms of Use.