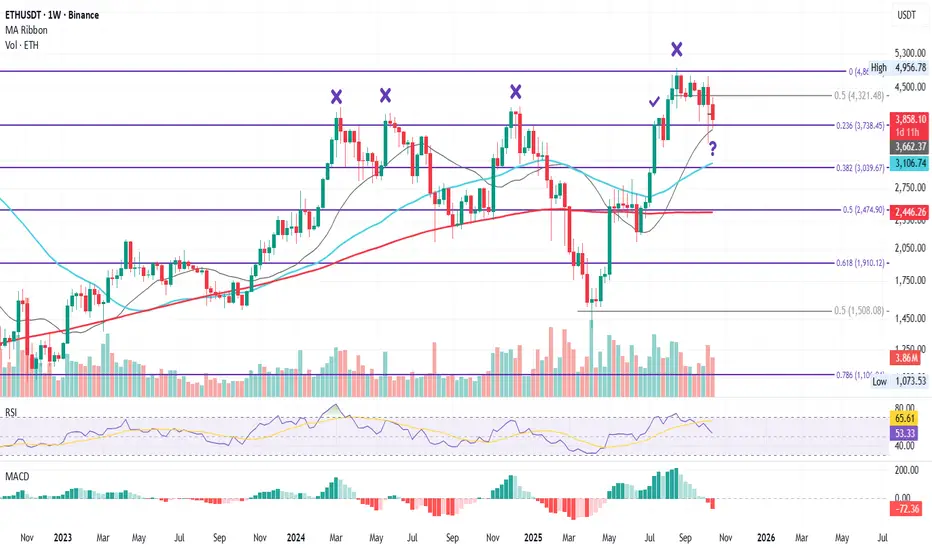
This is ETH on the weekly chart.
In this series, the main focus is on Fibonacci levels and the 21, 50, and 200-week moving averages, the key structures shaping ETH’s long-term rhythm.
The goal is to maintain clarity when zooming out from lower timeframes and to understand where ETH truly stands in the broader cycle.
The story here is one of repeated attempts and liquidity hunts.
ETH has tried three times to break through the 0.236 Fib level ($3738) and failed each time, needing deeper pullbacks to reload for another try.
After the first rejection (March 2024), ETH found support at the 0.382 Fib ($3039) near the 21-week MA, which helped fuel a second attempt.
The second rejection sent price lower to the 0.5 Fib ($2474) and the 200-week MA, from which ETH found strength for the third attempt.
The third rejection pushed price all the way to the $1500 zone, but that final deep flush gave enough strength for the fourth attempt, which finally succeeded: ETH broke through the 0.236 Fib.
However, after that success came another test, a rejection at the 0 Fib level ($4868), which now acts as major resistance.
This week, price is retesting the hard-won 0.236 Fib support ($3738), with the 21-week MA sitting just beneath it, forming a potential support confluence zone.
The big question now:
Will ETH repeat its own pattern again; holding the 0.236 Fib and 21W MA to attempt another push toward the 0 Fib level, only to face yet another rejection?
Weekly closes from here will tell the story, one candle at a time.
This chart will be updated each week to track how ETH behaves around these defining levels.
Always take profits and manage risk.
Interaction is welcome.
Related publications
Disclaimer
The information and publications are not meant to be, and do not constitute, financial, investment, trading, or other types of advice or recommendations supplied or endorsed by TradingView. Read more in the Terms of Use.
Related publications
Disclaimer
The information and publications are not meant to be, and do not constitute, financial, investment, trading, or other types of advice or recommendations supplied or endorsed by TradingView. Read more in the Terms of Use.