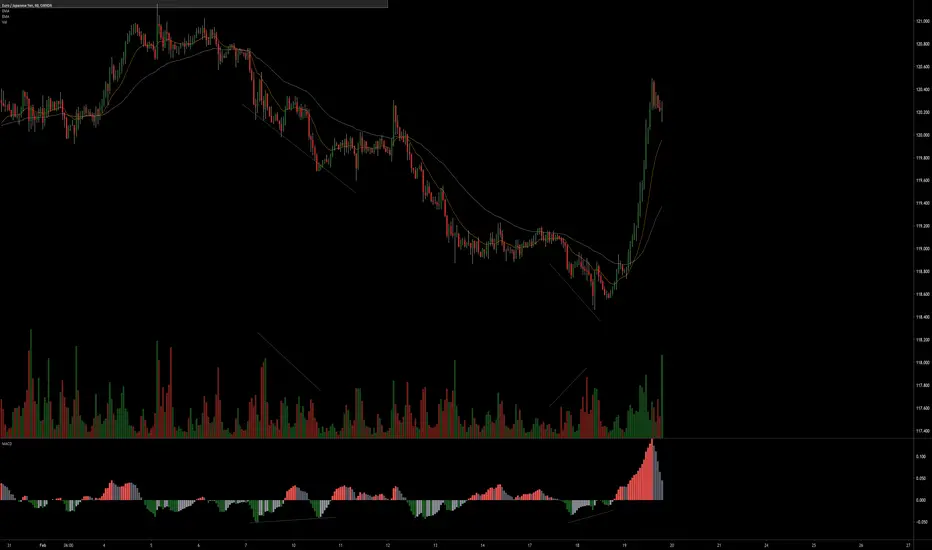
In this example there I have pointed out 2 MACD histogram positive divs.
Can you spot a key difference?
If using divergences, it is not a bad idea to utilize your volume. Notice the increase in demand, into new low ground, with the accommodating MACD positive divergence (example to the right).
Although there is a positive divergence (to the left of the chart) notice how the increase in demand is not as high. A counter trend situation did occur, but was rapidly met with enough supply to cancel the mark-up attempt (upthrust on high volume).
MACD histogram may be another useful confirmation tool. Not only for divergences, but it can also help one to identify accumulation and distribution areas above or below zero line ( for another time).
Hope this helps.
Practice*
Disclaimer
The information and publications are not meant to be, and do not constitute, financial, investment, trading, or other types of advice or recommendations supplied or endorsed by TradingView. Read more in the Terms of Use.
Disclaimer
The information and publications are not meant to be, and do not constitute, financial, investment, trading, or other types of advice or recommendations supplied or endorsed by TradingView. Read more in the Terms of Use.