# The Conviction Zone: FARTCOIN's Triple Rejection Pattern
## Market Structure Analysis
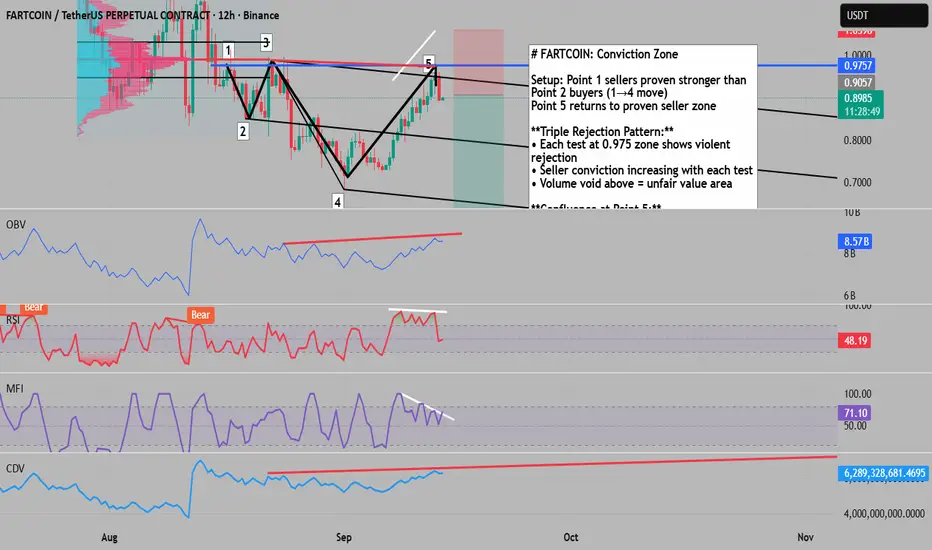
The price action from Points 1→4 established a critical fact: sellers at the 0.975 zone are objectively stronger than buyers from Point 2. This isn't opinion - it's proven by the deeper low at Point 4. Now at Point 5, price returns to these validated sellers, creating a high-probability short opportunity.
## The Triple Rejection Phenomenon
Each interaction with the 0.975 resistance zone demonstrates increasing seller aggression:
First Contact: Initial resistance established
Second Contact: Sharp rejection with increased volume
Third Contact (Point 5): Violent reversal on first touch
This escalating defense pattern reveals institutional sellers protecting their position with growing conviction. The lack of consolidation at resistance shows buyers have no interest in accumulating at these levels.
## Volume Structure Analysis
The volume profile tells a compelling story:
- Heavy Volume: 0.70-0.85 zone (value area)
- Volume Void: Above 0.975 (rejection zone)
- Interpretation: The thin volume above resistance indicates this is an "unfair" price - the market quickly rejects these levels to return to the accepted value area below.
## Divergence Confluence
### Classic Bearish Divergence
- Price: Higher high at Point 5
- RSI: Lower high (46 vs previous)
- MFI: Lower high confirming momentum loss
### Hidden Bearish Divergence (CVD)
- Price: Lower high structure
- CVD: Higher high showing distribution
- OBV: Similar hidden divergence pattern
- Meaning: Smart money is distributing into retail buying
## Advanced Technical Markers
### VWAP Analysis
Anchoring from Point 1 shows Point 5 precisely hitting the 2nd standard deviation - a statistically significant reversal zone where price typically mean reverts.
### Andrews Pitchfork
Using Points 2, 3, and 4 for construction, Point 5 touches the outer median line - a classic reversal point in pitchfork theory.
## Footprint Chart Revelations
The volume footprint provides surgical precision:
September 13, 5:00 AM:
- Bullish candle close ABOVE bullish imbalance
- BUT closes BELOW bearish imbalance
- Delta: NEGATIVE despite bullish bar
- Signal: Delta divergence = hidden selling
September 13, 5:00 PM:
- Closes below bearish imbalance
- Negative delta confirms selling
- No bullish warnings present
Additional Footprint Observations:
- Absorption visible at resistance (large volume, no progress)
- Negative cumulative delta during rallies
- Buy imbalances getting filled while sell imbalances hold
## Risk Management
Entry: 0.8987 (current price)
Stop Loss: 1.0598 (above Value Area High and volume profile resistance)
Target: 0.6212 (68.59% move)
Risk/Reward: 1:4.03
Position Sizing: Given memecoin volatility, use 50% of normal position size
## Market Context
- Local downtrend intact (lower highs, lower lows)
- Bitcoin correlation weakening (independent price action)
- Memecoin sector rotating out of favor
- Volume declining on rallies, expanding on selloffs
## Trade Execution Notes
Confirmation Signals:
- Break below 0.8900 with volume
- CVD continuing lower
- Failure to reclaim 0.9000 on any bounce
Invalidation:
- Acceptance above 0.9750 (multiple 4H closes)
- CVD turning positive above resistance
- Volume expansion on breakout
## The Edge
This setup combines:
1. Proven market structure (objective seller strength)
2. Multiple divergences (classic and hidden)
3. Statistical extremes (VWAP 2nd deviation)
4. Footprint confirmation (delta divergences)
5. Clean risk/reward with defined stop
The confluence of volume analysis, divergences, and footprint data creates a high-conviction short opportunity in an already weak market structure.
## Market Structure Analysis
The price action from Points 1→4 established a critical fact: sellers at the 0.975 zone are objectively stronger than buyers from Point 2. This isn't opinion - it's proven by the deeper low at Point 4. Now at Point 5, price returns to these validated sellers, creating a high-probability short opportunity.
## The Triple Rejection Phenomenon
Each interaction with the 0.975 resistance zone demonstrates increasing seller aggression:
First Contact: Initial resistance established
Second Contact: Sharp rejection with increased volume
Third Contact (Point 5): Violent reversal on first touch
This escalating defense pattern reveals institutional sellers protecting their position with growing conviction. The lack of consolidation at resistance shows buyers have no interest in accumulating at these levels.
## Volume Structure Analysis
The volume profile tells a compelling story:
- Heavy Volume: 0.70-0.85 zone (value area)
- Volume Void: Above 0.975 (rejection zone)
- Interpretation: The thin volume above resistance indicates this is an "unfair" price - the market quickly rejects these levels to return to the accepted value area below.
## Divergence Confluence
### Classic Bearish Divergence
- Price: Higher high at Point 5
- RSI: Lower high (46 vs previous)
- MFI: Lower high confirming momentum loss
### Hidden Bearish Divergence (CVD)
- Price: Lower high structure
- CVD: Higher high showing distribution
- OBV: Similar hidden divergence pattern
- Meaning: Smart money is distributing into retail buying
## Advanced Technical Markers
### VWAP Analysis
Anchoring from Point 1 shows Point 5 precisely hitting the 2nd standard deviation - a statistically significant reversal zone where price typically mean reverts.
### Andrews Pitchfork
Using Points 2, 3, and 4 for construction, Point 5 touches the outer median line - a classic reversal point in pitchfork theory.
## Footprint Chart Revelations
The volume footprint provides surgical precision:
September 13, 5:00 AM:
- Bullish candle close ABOVE bullish imbalance
- BUT closes BELOW bearish imbalance
- Delta: NEGATIVE despite bullish bar
- Signal: Delta divergence = hidden selling
September 13, 5:00 PM:
- Closes below bearish imbalance
- Negative delta confirms selling
- No bullish warnings present
Additional Footprint Observations:
- Absorption visible at resistance (large volume, no progress)
- Negative cumulative delta during rallies
- Buy imbalances getting filled while sell imbalances hold
## Risk Management
Entry: 0.8987 (current price)
Stop Loss: 1.0598 (above Value Area High and volume profile resistance)
Target: 0.6212 (68.59% move)
Risk/Reward: 1:4.03
Position Sizing: Given memecoin volatility, use 50% of normal position size
## Market Context
- Local downtrend intact (lower highs, lower lows)
- Bitcoin correlation weakening (independent price action)
- Memecoin sector rotating out of favor
- Volume declining on rallies, expanding on selloffs
## Trade Execution Notes
Confirmation Signals:
- Break below 0.8900 with volume
- CVD continuing lower
- Failure to reclaim 0.9000 on any bounce
Invalidation:
- Acceptance above 0.9750 (multiple 4H closes)
- CVD turning positive above resistance
- Volume expansion on breakout
## The Edge
This setup combines:
1. Proven market structure (objective seller strength)
2. Multiple divergences (classic and hidden)
3. Statistical extremes (VWAP 2nd deviation)
4. Footprint confirmation (delta divergences)
5. Clean risk/reward with defined stop
The confluence of volume analysis, divergences, and footprint data creates a high-conviction short opportunity in an already weak market structure.
for trading mentorship and community, message me on telegram : jacesabr_real
Disclaimer
The information and publications are not meant to be, and do not constitute, financial, investment, trading, or other types of advice or recommendations supplied or endorsed by TradingView. Read more in the Terms of Use.