Short
Swing PUTS - see 30m, daily, weekly charts
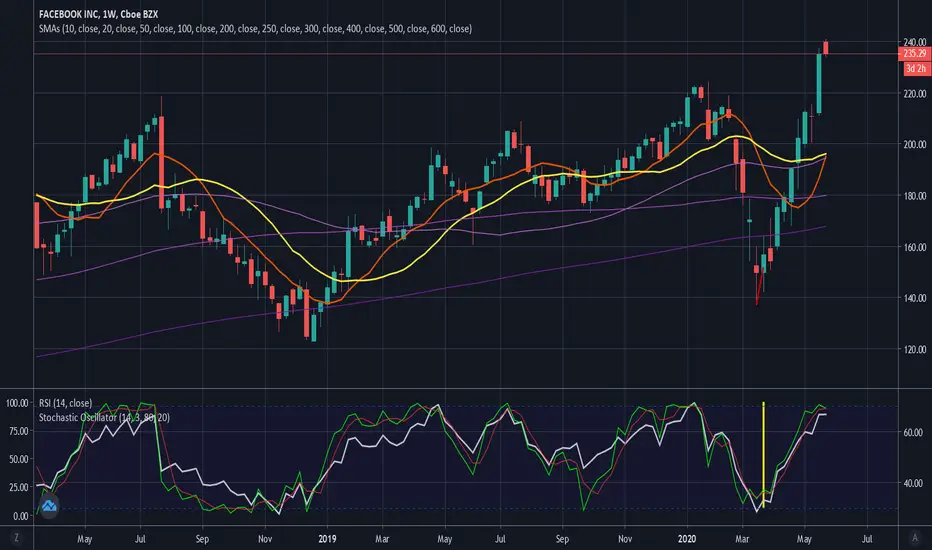
The weekly chart gives you the reason for puts. On 30min chart the stochastic is below RSI. Here are confirmations:
* 30min RSI below 50
* daily stochastic moving below RSI
* bearish candle patterns
Set targets and take profits along the way.
I used 5 and 30 min charts to buy weekly 235 puts at $2.80 and I sold most of them for $3.50. Swing puts will allow you to capture overnight selling, while buying and theta will "hurt" your position less. You can also watch this chart over the next two weeks to predict and learn. There will be multiple trading opportunites on 5-30 min timeframes.
Disclaimer
The information and publications are not meant to be, and do not constitute, financial, investment, trading, or other types of advice or recommendations supplied or endorsed by TradingView. Read more in the Terms of Use.
Disclaimer
The information and publications are not meant to be, and do not constitute, financial, investment, trading, or other types of advice or recommendations supplied or endorsed by TradingView. Read more in the Terms of Use.