Summary
Structure flipped from a lengthy falling channel to a sustained uptrend after a clear breakout.
Post-breakout trend evolved into a parabolic advance with accelerating momentum.
Trend remains bullish but risk of sharp mean‑reversion increases as curvature steepens.
Plan: Buy-the-dip toward dynamic supports with strict risk control; avoid chasing vertical candles.
What the chart shows
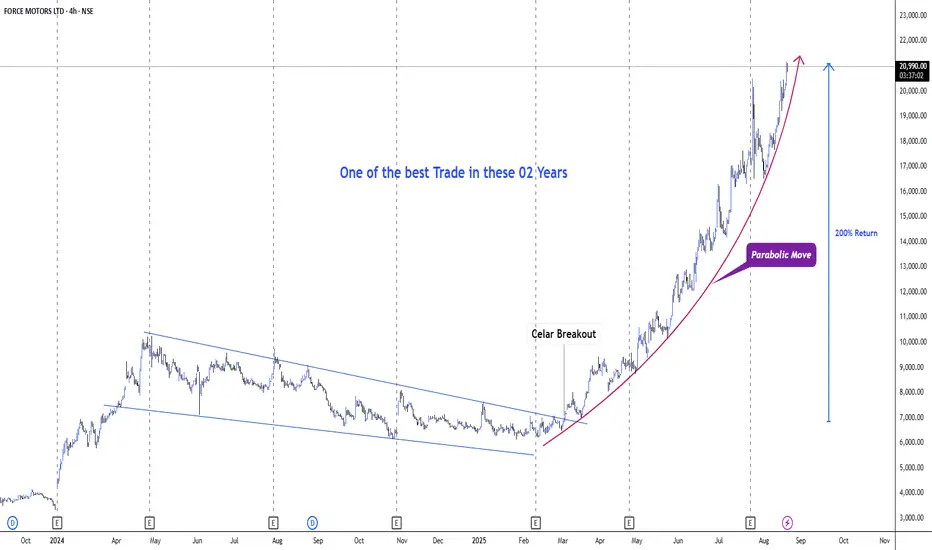
Downtrend phase: A well-defined descending channel persisted for several months into early 2025.
Breakout: Price broke above the channel with expansion in range and follow‑through—textbook “change of character”.
Trend maturation: The advance has transitioned into a parabolic curve with higher highs/lows compressing in time, indicating momentum clustering and potential late‑stage acceleration.
Return magnitude: The move from breakout base to current print approximates a 200% run, per the annotation, consistent with parabolic behavior.
Key Levels (from the image)
Immediate resistance: Area near 20,800–21,000 where price is currently pressing along the parabolic arc.
Rising dynamic support: Parabolic guide curve; secondary support around prior swing clusters roughly 17,000–18,000.
Deeper support/invalidations: Breakout shelf and last higher‑low zone around 13,500–14,500. Loss of this zone would damage the uptrend structure.
Momentum & Risk Read
Strong momentum regime: Tight, shallow pullbacks; frequent small-bodied consolidations followed by quick breakouts—sign of aggressive dip buying.
Parabolic risk: As curvature steepens, the probability of a swift vertical drop to the curve or to the last consolidation increases. Expect 10–20% whips possible without trend break.
Volume/OBV not visible in the image; plan assumes momentum still intact but reactive.
Trading Plan (for TradingView post)
Bias: Bullish, momentum continuation with caution.
Do not chase extended candles at the top of the arc. Prefer pullbacks to structure.
Entries
Pullback-to-curve buy: Stagger bids on a retrace to the parabolic guide or the most recent 4h demand block.
Breakout‑continuation: If price flags below 21,000 and breaks out on expanding 4h range, enter on break with tight risk.
Stops
Tactical stop: Below the most recent 4h swing low that anchors the parabolic curve (keep risk ≤1R of average upswing).
Structural stop: Below 17,000 (loss of mid‑trend shelf) if position trades are taken.
Hard invalidation: Close below 13,500–14,500 zone would signal trend deterioration; reduce exposure materially.
Targets
Near‑term: Trail into strength; take partials on each vertical expansion, re‑add on pullbacks.
Extensions: Use measured‑move logic from last consolidation height; alternatively, trail below prior 4h lows to stay in the parabola.
If a blow‑off top occurs (wide spread up bar followed by immediate reversal), exit 50–100% and wait for base rebuild.
Risk Management
Scale‑in approach: 1/3 on first touch of curve, 1/3 on confirmation (bullish 4h reversal), 1/3 on break of minor flag.
Never average down below structural stop; honor invalidation.
Position sizing should anticipate volatility spikes typical of parabolic phases.
Trade Triggers to Monitor
4h bearish engulfing closing through the curve with follow‑through: caution—expect mean reversion to 17,000–18,000.
Tight 4h pennant under resistance, then high‑range breakout: momentum continuation.
RSI/Momentum divergence on 4h coupled with failure to make new highs: signals cooling; switch to swing‑reversion tactics.
Structure flipped from a lengthy falling channel to a sustained uptrend after a clear breakout.
Post-breakout trend evolved into a parabolic advance with accelerating momentum.
Trend remains bullish but risk of sharp mean‑reversion increases as curvature steepens.
Plan: Buy-the-dip toward dynamic supports with strict risk control; avoid chasing vertical candles.
What the chart shows
Downtrend phase: A well-defined descending channel persisted for several months into early 2025.
Breakout: Price broke above the channel with expansion in range and follow‑through—textbook “change of character”.
Trend maturation: The advance has transitioned into a parabolic curve with higher highs/lows compressing in time, indicating momentum clustering and potential late‑stage acceleration.
Return magnitude: The move from breakout base to current print approximates a 200% run, per the annotation, consistent with parabolic behavior.
Key Levels (from the image)
Immediate resistance: Area near 20,800–21,000 where price is currently pressing along the parabolic arc.
Rising dynamic support: Parabolic guide curve; secondary support around prior swing clusters roughly 17,000–18,000.
Deeper support/invalidations: Breakout shelf and last higher‑low zone around 13,500–14,500. Loss of this zone would damage the uptrend structure.
Momentum & Risk Read
Strong momentum regime: Tight, shallow pullbacks; frequent small-bodied consolidations followed by quick breakouts—sign of aggressive dip buying.
Parabolic risk: As curvature steepens, the probability of a swift vertical drop to the curve or to the last consolidation increases. Expect 10–20% whips possible without trend break.
Volume/OBV not visible in the image; plan assumes momentum still intact but reactive.
Trading Plan (for TradingView post)
Bias: Bullish, momentum continuation with caution.
Do not chase extended candles at the top of the arc. Prefer pullbacks to structure.
Entries
Pullback-to-curve buy: Stagger bids on a retrace to the parabolic guide or the most recent 4h demand block.
Breakout‑continuation: If price flags below 21,000 and breaks out on expanding 4h range, enter on break with tight risk.
Stops
Tactical stop: Below the most recent 4h swing low that anchors the parabolic curve (keep risk ≤1R of average upswing).
Structural stop: Below 17,000 (loss of mid‑trend shelf) if position trades are taken.
Hard invalidation: Close below 13,500–14,500 zone would signal trend deterioration; reduce exposure materially.
Targets
Near‑term: Trail into strength; take partials on each vertical expansion, re‑add on pullbacks.
Extensions: Use measured‑move logic from last consolidation height; alternatively, trail below prior 4h lows to stay in the parabola.
If a blow‑off top occurs (wide spread up bar followed by immediate reversal), exit 50–100% and wait for base rebuild.
Risk Management
Scale‑in approach: 1/3 on first touch of curve, 1/3 on confirmation (bullish 4h reversal), 1/3 on break of minor flag.
Never average down below structural stop; honor invalidation.
Position sizing should anticipate volatility spikes typical of parabolic phases.
Trade Triggers to Monitor
4h bearish engulfing closing through the curve with follow‑through: caution—expect mean reversion to 17,000–18,000.
Tight 4h pennant under resistance, then high‑range breakout: momentum continuation.
RSI/Momentum divergence on 4h coupled with failure to make new highs: signals cooling; switch to swing‑reversion tactics.
Related publications
Disclaimer
The information and publications are not meant to be, and do not constitute, financial, investment, trading, or other types of advice or recommendations supplied or endorsed by TradingView. Read more in the Terms of Use.
Related publications
Disclaimer
The information and publications are not meant to be, and do not constitute, financial, investment, trading, or other types of advice or recommendations supplied or endorsed by TradingView. Read more in the Terms of Use.