hey all! How are you doing?
Date: October 24, 2025
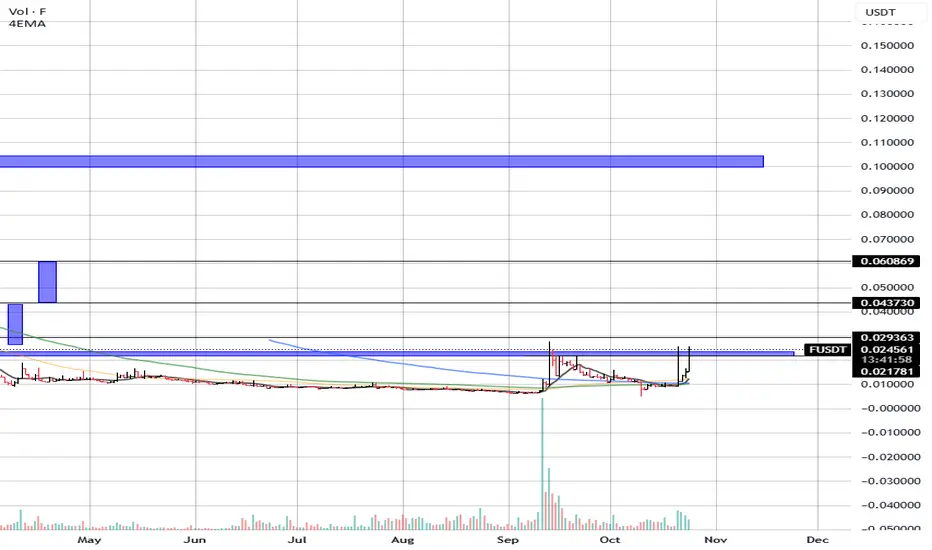
After months of sideways movement and low volatility, F is showing early signs of a potential trend reversal. The token is testing a key resistance level that has capped price since May, and a breakout from this area could open the door to a more sustained recovery phase.
🔍 Technical Overview:
Current Price: $0.0252
4EMA: $0.0122
👉 The price remains well above the short-term EMA, indicating growing bullish momentum.
📊 Market Structure:
F has spent several months forming a wide accumulation range between $0.0100 – $0.0200 (blue zone).
The recent surge in both price and volume suggests renewed interest and accumulation by buyers.
Price is now attempting to break above the $0.029 zone, a crucial structural level that could flip from resistance to support if the move holds.
📉 Support Levels:
$0.0217 → Immediate local support.
$0.0178 → Mid-range support; potential retest level if price pulls back.
$0.0100 → Major accumulation base and invalidation level.
📈 Resistance Levels / Targets:
$0.0293 → Current breakout resistance.
$0.0437 → Next major target aligned with previous local high.
$0.0608 → Larger structural resistance and potential breakout objective.
$0.1100 → Extended target area based on the measured move projection from the base structure.
📊 Volume & Momentum Notes:
The volume expansion seen during the recent move signals a shift in market dynamics, likely the beginning of trend rotation.
The RSI (not visible here but inferred from price structure) likely shows a healthy upward momentum, still below extreme overbought zones.
If price successfully consolidates above $0.025, it would confirm a structural breakout with room for continuation.
🎯 Creative Bullish Scenario:
F looks poised for a potential multi-leg breakout, emerging from a long-term accumulation range.
If the current momentum holds, a short-term rally toward $0.043 – $0.060 is plausible, with the possibility of a larger swing toward $0.110 as liquidity returns and traders re-engage with the asset.
This setup resembles a “spring and expansion” pattern, where a long base builds energy before an impulsive move.
📉 Invalidation:
A close back below $0.0178 would suggest a failed breakout and potential re-entry into the accumulation zone.
⚡ Summary:
F/USDT is showing promising early signs of a trend reversal.
A confirmed breakout above $0.0293 could mark the beginning of a medium-term bullish phase with upside targets at $0.0437 → $0.0608 → $0.1100.
As long as the price holds above $0.0217, the bullish outlook remains valid.
good trading!!
Date: October 24, 2025
After months of sideways movement and low volatility, F is showing early signs of a potential trend reversal. The token is testing a key resistance level that has capped price since May, and a breakout from this area could open the door to a more sustained recovery phase.
🔍 Technical Overview:
Current Price: $0.0252
4EMA: $0.0122
👉 The price remains well above the short-term EMA, indicating growing bullish momentum.
📊 Market Structure:
F has spent several months forming a wide accumulation range between $0.0100 – $0.0200 (blue zone).
The recent surge in both price and volume suggests renewed interest and accumulation by buyers.
Price is now attempting to break above the $0.029 zone, a crucial structural level that could flip from resistance to support if the move holds.
📉 Support Levels:
$0.0217 → Immediate local support.
$0.0178 → Mid-range support; potential retest level if price pulls back.
$0.0100 → Major accumulation base and invalidation level.
📈 Resistance Levels / Targets:
$0.0293 → Current breakout resistance.
$0.0437 → Next major target aligned with previous local high.
$0.0608 → Larger structural resistance and potential breakout objective.
$0.1100 → Extended target area based on the measured move projection from the base structure.
📊 Volume & Momentum Notes:
The volume expansion seen during the recent move signals a shift in market dynamics, likely the beginning of trend rotation.
The RSI (not visible here but inferred from price structure) likely shows a healthy upward momentum, still below extreme overbought zones.
If price successfully consolidates above $0.025, it would confirm a structural breakout with room for continuation.
🎯 Creative Bullish Scenario:
F looks poised for a potential multi-leg breakout, emerging from a long-term accumulation range.
If the current momentum holds, a short-term rally toward $0.043 – $0.060 is plausible, with the possibility of a larger swing toward $0.110 as liquidity returns and traders re-engage with the asset.
This setup resembles a “spring and expansion” pattern, where a long base builds energy before an impulsive move.
📉 Invalidation:
A close back below $0.0178 would suggest a failed breakout and potential re-entry into the accumulation zone.
⚡ Summary:
F/USDT is showing promising early signs of a trend reversal.
A confirmed breakout above $0.0293 could mark the beginning of a medium-term bullish phase with upside targets at $0.0437 → $0.0608 → $0.1100.
As long as the price holds above $0.0217, the bullish outlook remains valid.
good trading!!
Disclaimer
The information and publications are not meant to be, and do not constitute, financial, investment, trading, or other types of advice or recommendations supplied or endorsed by TradingView. Read more in the Terms of Use.
Disclaimer
The information and publications are not meant to be, and do not constitute, financial, investment, trading, or other types of advice or recommendations supplied or endorsed by TradingView. Read more in the Terms of Use.