What happens when Ichimoku and Fibonacci are combined? Simple! We get a powerful trend pullback strategy which make sit much safer for us to follow a trend. Essentially, we will be making entries and trading on pivot points identified by the Fibonacci levels. If you like simple trading, this is it for you.
For trend trading, the Ichimoku trading system is no doubt one of the most widely accepted trading system. Long term traders prefer to make use of the Ichimoku trading indicator as a way to capture trends in the markets which often persist over a prolonged period of time. While the Ichimoku system is in itself a complete trading system, it is by no means a fail safe method as price tends to post sharp corrections and could result in false signals. In order to avoid this, applying the Fibonacci tool to the Ichimoku trading system can be a versatile way to enter the trends on a retracement. Based on simple rules and on the fact that price never tends to move in one straight direction, the Fibonacci tool can be used to compliment the trend signals shown by the Ichimoku trading system. In this trading strategy, we present a rather simple way for traders to take up positions on a retracement after a trend is confirmed.
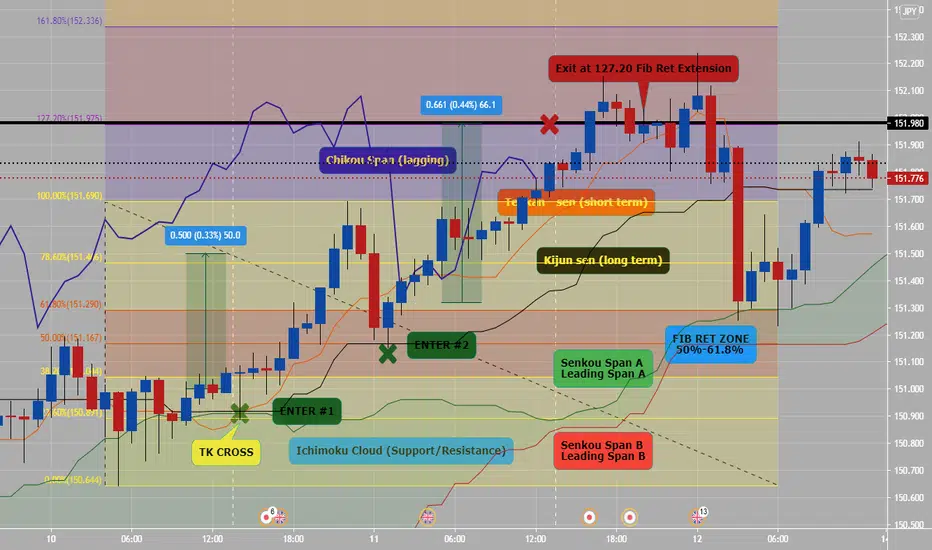
We make use of the Ichimoku trading indicator in its entirety. This includes using the Ichimoku Cloud, the Chikou Span, Tenkan and Kijun Sen. After applying the Ichimoku system to the chart, the next step is to wait for buy and sell signals as outlined below.
Buy Signal (example on attached chart)
Wait for price to break above the Ichimoku Cloud from below. Prices should rise steadily before starting a retracement. When prices start to retreat from the first high above the cloud, using the Fibonacci tool, connect the high and the low. Wait for price to retrace the 61.8% Fibonacci level. At 61.8% retracement, simply follow the Ichimoku signals, which is a bullish crossover of Tenkan and Kijun Sen and price trading above the cloud. Exit at the 127.2% Fib level with stops at the low near the 61.8% retracement.
Sell Signal
Wait for price to break the cloud from above. Prices need to continue to decline steadily before retracing the move. Using the Fibonacci tool, connect the high and low and wait for price to retrace to 61.8% Fibonacci level. At this point, traders can sell, based on the regular Ichimoku trading signals, which is a bearish crossover of the Tenkan and Kijun Sen and prices trading below the cloud. Exit at 127.2% Fib level with stops at the high near the 61.8% retracement.
Noted on Charts: Parts of Ichimoku, TK cross (Enter #1), possible pip profit after #1 entry and/or #2 entry noted, Please you tube or google for more info.
Ichimoku PDF and download and read at your leisure- As always, risk management and price actions is all you need to trade well and win in Forex. gl
For trend trading, the Ichimoku trading system is no doubt one of the most widely accepted trading system. Long term traders prefer to make use of the Ichimoku trading indicator as a way to capture trends in the markets which often persist over a prolonged period of time. While the Ichimoku system is in itself a complete trading system, it is by no means a fail safe method as price tends to post sharp corrections and could result in false signals. In order to avoid this, applying the Fibonacci tool to the Ichimoku trading system can be a versatile way to enter the trends on a retracement. Based on simple rules and on the fact that price never tends to move in one straight direction, the Fibonacci tool can be used to compliment the trend signals shown by the Ichimoku trading system. In this trading strategy, we present a rather simple way for traders to take up positions on a retracement after a trend is confirmed.
We make use of the Ichimoku trading indicator in its entirety. This includes using the Ichimoku Cloud, the Chikou Span, Tenkan and Kijun Sen. After applying the Ichimoku system to the chart, the next step is to wait for buy and sell signals as outlined below.
Buy Signal (example on attached chart)
Wait for price to break above the Ichimoku Cloud from below. Prices should rise steadily before starting a retracement. When prices start to retreat from the first high above the cloud, using the Fibonacci tool, connect the high and the low. Wait for price to retrace the 61.8% Fibonacci level. At 61.8% retracement, simply follow the Ichimoku signals, which is a bullish crossover of Tenkan and Kijun Sen and price trading above the cloud. Exit at the 127.2% Fib level with stops at the low near the 61.8% retracement.
Sell Signal
Wait for price to break the cloud from above. Prices need to continue to decline steadily before retracing the move. Using the Fibonacci tool, connect the high and low and wait for price to retrace to 61.8% Fibonacci level. At this point, traders can sell, based on the regular Ichimoku trading signals, which is a bearish crossover of the Tenkan and Kijun Sen and prices trading below the cloud. Exit at 127.2% Fib level with stops at the high near the 61.8% retracement.
Noted on Charts: Parts of Ichimoku, TK cross (Enter #1), possible pip profit after #1 entry and/or #2 entry noted, Please you tube or google for more info.
Ichimoku PDF and download and read at your leisure- As always, risk management and price actions is all you need to trade well and win in Forex. gl
Disclaimer
The information and publications are not meant to be, and do not constitute, financial, investment, trading, or other types of advice or recommendations supplied or endorsed by TradingView. Read more in the Terms of Use.
Disclaimer
The information and publications are not meant to be, and do not constitute, financial, investment, trading, or other types of advice or recommendations supplied or endorsed by TradingView. Read more in the Terms of Use.