Midterm forecast:
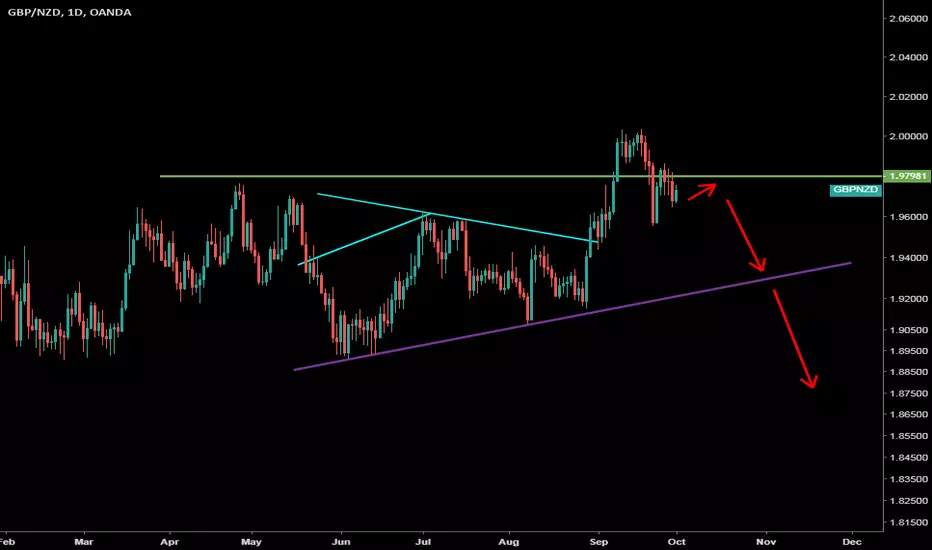
Although current trend is uptrend, but we forecast a downtrend wave would begin in Midterm.
Technical analysis:
A peak is formed in daily chart at 1.9855 on 09/26/2018, so more losses to support(s) 1.9620, 1.9460, 1.9350 and more depths is expected.
Price is below WEMA21, if price rises more, this line can act as dynamic resistance against more gains.
Relative strength index (RSI) is 50.
algorithmic trader - I have quantified sentiment necessary for trading elliott waves
Disclaimer
The information and publications are not meant to be, and do not constitute, financial, investment, trading, or other types of advice or recommendations supplied or endorsed by TradingView. Read more in the Terms of Use.