The GER40 is currently positioned at 23,432.7, and we're witnessing a pivotal moment in the intraday structure. The index has pulled back from recent highs, and multiple technical signals are flashing across our radar. Let's break down what matters for today's session. 📊
Current Market Landscape
The 4H chart reveals a Rising Wedge pattern that's showing signs of exhaustion. This bearish reversal formation developed over the past week, and we've just seen a breakdown from the lower trendline. The wedge measured move projects downside potential toward 23,200-23,150.
From a Wyckoff distribution perspective, the recent price action exhibits classic topping characteristics. We observed:
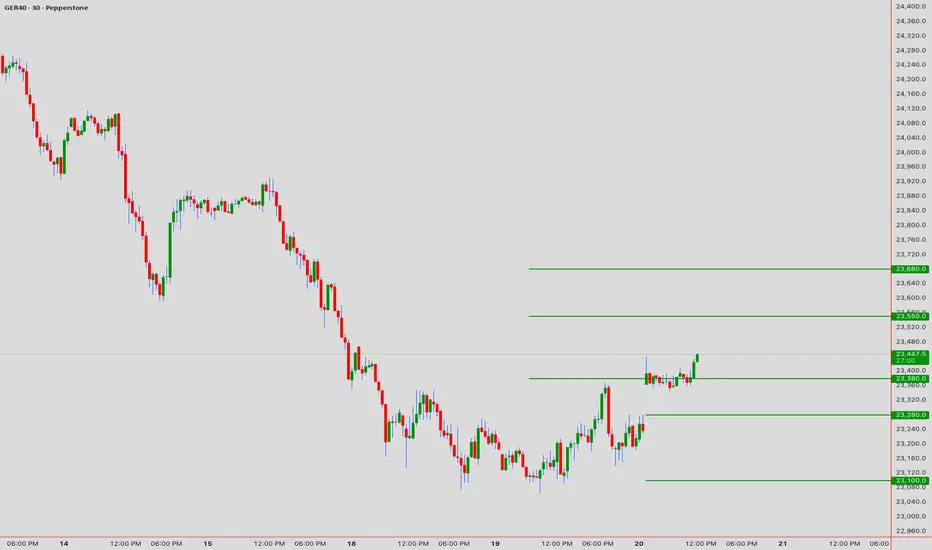
- Buying Climax (BC) near 23,680
- Automatic Reaction (AR) down to 23,380
- Secondary Test (ST) failing at 23,620
- Sign of Weakness (SOW) currently unfolding
This distribution schematic suggests institutional selling pressure is building.
Elliott Wave Framework 🌊
The wave structure indicates completion of a five-wave impulse from the 23,100 low. Current labeling suggests:
- Wave (i)-(v) impulse completed at 23,680
- Wave (A) correction down to 23,380
- Wave (B) bounce exhausted at 23,550
- Wave (C) decline currently in progress (targeting 23,150-23,200)
The internal structure of wave (C) shows three sub-waves developing, with wave iii potentially extending lower.
Key Price Zones 🎯
Resistance Barriers:
- R1: 23,520 (broken support turned resistance + 20 EMA on 1H)
- R2: 23,620 (failed secondary test + VWAP)
- R3: 23,680 (swing high + psychological)
Support Anchors:
- S1: 23,380 (initial wave A low + demand zone)
- S2: 23,280 (Fibonacci 0.618 retracement)
- S3: 23,150 (measured move target + major support)
Technical Indicator Alignment ⚡
- RSI (1H): 38.2 - approaching oversold, but no divergence yet
- MACD: Bearish crossover confirmed, histogram expanding downward
- Bollinger Bands: Price hugging lower band, volatility expanding
- Ichimoku Cloud: Price broke below cloud on 1H (bearish shift), Tenkan below Kijun
- Volume: Increasing on down moves (confirming selling pressure)
Harmonic Pattern Analysis
A Bearish Bat pattern completed at the 23,680 level:
- X: 23,100
- A: 23,580
- B: 23,320
- C: 23,650
- D: 23,680 (PRZ completion)
The pattern's measured move aligns with our 23,150 target, providing multi-method confluence.
Candlestick Patterns
The 1H chart printed a Bearish Engulfing pattern at 23,550, followed by consecutive bearish candles. This confirms rejection at resistance and validates the distribution narrative.
Trading Game Plan 💼
Scenario A - Continuation Short:
Entry: 23,450 (current area) or 23,520 retest
Target 1: 23,320
Target 2: 23,200
Stop Loss: 23,580
Scenario B - Breakdown Confirmation:
Entry: 23,375 break (below S1 with retest)
Target 1: 23,280
Target 2: 23,150
Stop Loss: 23,460
Timeframe Coordination 🕐
- 5M: Precision entry timing and scalp exits
- 15M: Momentum shifts and micro-structure breaks
- 1H: Primary trend direction and pattern confirmation
- 4H: Macro structure and major support/resistance
Market Outlook
The technical picture is tilted bearish for the immediate term. The rising wedge breakdown, Wyckoff distribution signs, completed harmonic pattern, and bearish Elliott wave count all point toward further downside. The 23,380 level is critical—sustained break below opens the door to 23,150.
However, watch for potential bullish reversal signals if we reach the 23,280-23,200 zone. That's where buyers may step in aggressively. Until then, the path of least resistance is lower. 📉
Trade with discipline, respect your stops, and let the market prove itself. 🎯
---
Disclaimer: This content is for educational purposes only. Trading involves risk. Conduct your own analysis before making trading decisions.
I am nothing @shunya.trade
Disclaimer
The information and publications are not meant to be, and do not constitute, financial, investment, trading, or other types of advice or recommendations supplied or endorsed by TradingView. Read more in the Terms of Use.
I am nothing @shunya.trade
Disclaimer
The information and publications are not meant to be, and do not constitute, financial, investment, trading, or other types of advice or recommendations supplied or endorsed by TradingView. Read more in the Terms of Use.