The Germany 40 index registered its last record high at 23639 on July 9th and since that date has struggled to regain the upside momentum that took it there, with general sentiment towards European indices taking a dip after the EU agreed to a trade deal imposing 15% tariffs on exports to the US, the ECB decided to pause cutting interest rates to assess incoming economic growth and inflation data, and Q2 earnings from European corporates disappointed when measured against analyst expectations.
However, things have started to improve in August, with the Germany 40 experiencing a rally of 5% from its August 1st lows of 23378 to last Friday’s highs at 24544. So, what’s changed? , well general risk sentiment has been boosted by increased trader hopes of a Federal Reserve interest rate cut in September, and perhaps more importantly for European indices, and the Germany 40 in particular, anticipation that last Friday’s (August 15th) Alaskan summit between President Trump and Russian President Putin could be the first tentative step to agreeing an extended ceasefire in Ukraine, potentially even a peace agreement.
Early trading in European indices this morning has reflected guarded optimism that progress is being made regarding Ukraine, with the Germany 40 index currently up 0.2% at 24,418 (0630 BST).
Whether this move can extend further, may now depend on the outcome of a meeting scheduled for later today in Washington between President Trump, Ukrainian President Zelenskiy and key European leaders, including German Chancellor Merz, UK PM Starmer and French President Macron.
According to Bloomberg, talks are expected to focus on US security guarantees, territorial issues and continued support for Ukraine in its defence against Russian aggression.
Technical Update: Focus on All-Time Highs
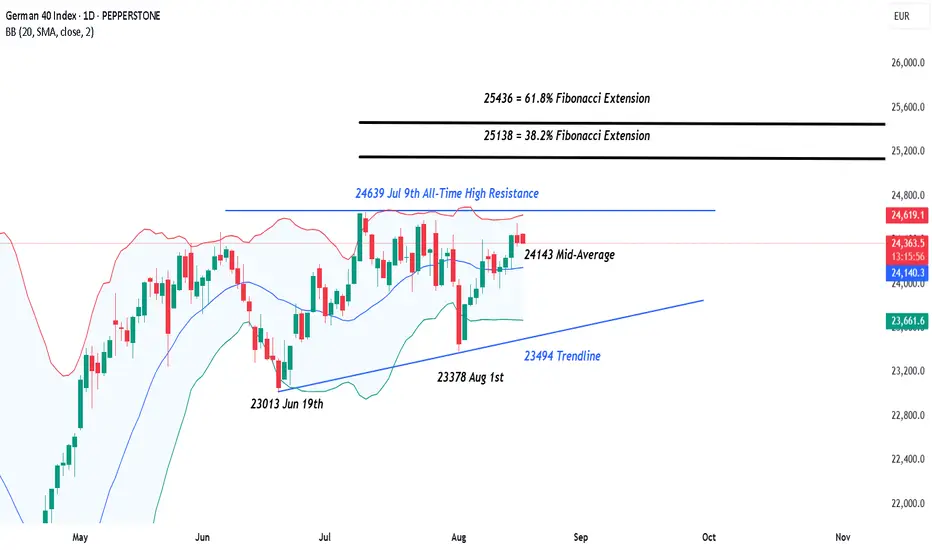
Since early June, the Germany 40 index has failed to establish a sustainable trend, be it to the up or downside. As the chart below shows, this has resulted in sideways price activity between resistance marked by 24639, the July 9th all-time high and support offered by the uptrend connecting the 23013 June 19th and 23378 August 1st lows. This trendline currently stands at 23494.

This type of sideways activity can extend over a prolonged period, with only a closing break above resistance or below the support levels suggesting a more prolonged phase of price movement, in the direction of the break.
However, with the on-going discussions regarding Ukraine increasing the potential for Germany 40 index volatility, traders may be asking if a breakout from the current range is possibly about to materialise, and if so, where the next support or resistance levels may then stand.
Possible Resistance Levels:
Having already found selling interest at 24639 and it being the current all-time price high, there is a possibility that if strength re-emerges, sellers may once again be found at this level. As such, 24639 could be a resistance focus for traders in the near term.
While not a guarantee of price strength, daily closes above 24639, could reinforce the upside potential for the Germany 40 index. If confirmed breaks materialise, prices may continue their advance to the next possible resistance at 25138, which is the 38.2% Fibonacci extension.
Potential for a further phase of price strength could in turn be suggested by closing breaks above this 25138 level, which may bring the higher resistance at 25436 (61.8% extension) into play.
Potential Support Levels:
To the downside, during periods of price strength, the Bollinger mid-average can be a potential support. For the Germany 40 index, this currently stands at 24134.
Should prices manage closing breaks below 24134, it may prompt further attempts to extend any weakness to test the 23494 trendline support, which may prove to be a more important focus for traders.
With this 23494 level representing the lower extremes of the current sideways range, it might be closes below here that prompt further weakness towards 23378, the August 1st low, possibly even 23013, a support level equal to the June 19th extreme.
The material provided here has not been prepared accordance with legal requirements designed to promote the independence of investment research and as such is considered to be a marketing communication. Whilst it is not subject to any prohibition on dealing ahead of the dissemination of investment research, we will not seek to take any advantage before providing it to our clients.
Pepperstone doesn’t represent that the material provided here is accurate, current or complete, and therefore shouldn’t be relied upon as such. The information, whether from a third party or not, isn’t to be considered as a recommendation; or an offer to buy or sell; or the solicitation of an offer to buy or sell any security, financial product or instrument; or to participate in any particular trading strategy. It does not take into account readers’ financial situation or investment objectives. We advise any readers of this content to seek their own advice. Without the approval of Pepperstone, reproduction or redistribution of this information isn’t permitted.
However, things have started to improve in August, with the Germany 40 experiencing a rally of 5% from its August 1st lows of 23378 to last Friday’s highs at 24544. So, what’s changed? , well general risk sentiment has been boosted by increased trader hopes of a Federal Reserve interest rate cut in September, and perhaps more importantly for European indices, and the Germany 40 in particular, anticipation that last Friday’s (August 15th) Alaskan summit between President Trump and Russian President Putin could be the first tentative step to agreeing an extended ceasefire in Ukraine, potentially even a peace agreement.
Early trading in European indices this morning has reflected guarded optimism that progress is being made regarding Ukraine, with the Germany 40 index currently up 0.2% at 24,418 (0630 BST).
Whether this move can extend further, may now depend on the outcome of a meeting scheduled for later today in Washington between President Trump, Ukrainian President Zelenskiy and key European leaders, including German Chancellor Merz, UK PM Starmer and French President Macron.
According to Bloomberg, talks are expected to focus on US security guarantees, territorial issues and continued support for Ukraine in its defence against Russian aggression.
Technical Update: Focus on All-Time Highs
Since early June, the Germany 40 index has failed to establish a sustainable trend, be it to the up or downside. As the chart below shows, this has resulted in sideways price activity between resistance marked by 24639, the July 9th all-time high and support offered by the uptrend connecting the 23013 June 19th and 23378 August 1st lows. This trendline currently stands at 23494.
This type of sideways activity can extend over a prolonged period, with only a closing break above resistance or below the support levels suggesting a more prolonged phase of price movement, in the direction of the break.
However, with the on-going discussions regarding Ukraine increasing the potential for Germany 40 index volatility, traders may be asking if a breakout from the current range is possibly about to materialise, and if so, where the next support or resistance levels may then stand.
Possible Resistance Levels:
Having already found selling interest at 24639 and it being the current all-time price high, there is a possibility that if strength re-emerges, sellers may once again be found at this level. As such, 24639 could be a resistance focus for traders in the near term.
While not a guarantee of price strength, daily closes above 24639, could reinforce the upside potential for the Germany 40 index. If confirmed breaks materialise, prices may continue their advance to the next possible resistance at 25138, which is the 38.2% Fibonacci extension.
Potential for a further phase of price strength could in turn be suggested by closing breaks above this 25138 level, which may bring the higher resistance at 25436 (61.8% extension) into play.
Potential Support Levels:
To the downside, during periods of price strength, the Bollinger mid-average can be a potential support. For the Germany 40 index, this currently stands at 24134.
Should prices manage closing breaks below 24134, it may prompt further attempts to extend any weakness to test the 23494 trendline support, which may prove to be a more important focus for traders.
With this 23494 level representing the lower extremes of the current sideways range, it might be closes below here that prompt further weakness towards 23378, the August 1st low, possibly even 23013, a support level equal to the June 19th extreme.
The material provided here has not been prepared accordance with legal requirements designed to promote the independence of investment research and as such is considered to be a marketing communication. Whilst it is not subject to any prohibition on dealing ahead of the dissemination of investment research, we will not seek to take any advantage before providing it to our clients.
Pepperstone doesn’t represent that the material provided here is accurate, current or complete, and therefore shouldn’t be relied upon as such. The information, whether from a third party or not, isn’t to be considered as a recommendation; or an offer to buy or sell; or the solicitation of an offer to buy or sell any security, financial product or instrument; or to participate in any particular trading strategy. It does not take into account readers’ financial situation or investment objectives. We advise any readers of this content to seek their own advice. Without the approval of Pepperstone, reproduction or redistribution of this information isn’t permitted.
Global risk Warning CFDs are complex instruments and come with a high risk of losing money rapidly due to leverage. Between 74-89% of retail investor accounts lose money when trading in CFDs. You should consider whether you understand how CFD
Disclaimer
The information and publications are not meant to be, and do not constitute, financial, investment, trading, or other types of advice or recommendations supplied or endorsed by TradingView. Read more in the Terms of Use.