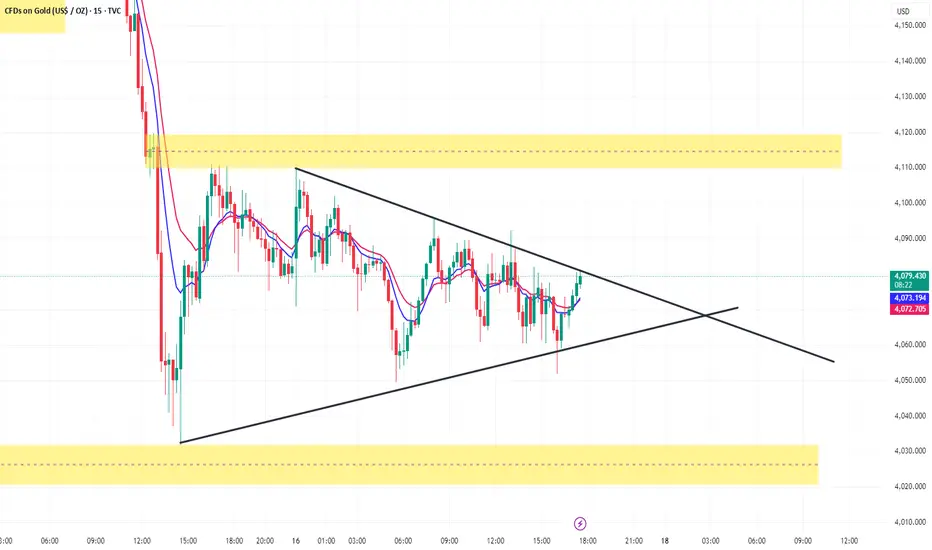
**Symmetrical Triangle** structure.
### **Why this is a Symmetrical Triangle**
* You have **lower highs** (descending trendline from top).
* You have **higher lows** (ascending trendline from bottom).
* Price is getting squeezed toward the **apex**.
* Volatility is decreasing → typical behavior before a breakout.
### **What this structure means**
A symmetrical triangle is a **neutral continuation pattern**, meaning:
* It can break **up** or **down**, depending on which side is broken with volume.
* The breakout usually decides the next big move.
### **Key breakout zones**
* **Bullish breakout:** Above ~4088–4092 zone (upper trendline + near supply)
* **Bearish breakout:** Below ~4060–4055 zone (lower trendline)
### **Also important**
You have **strong supply above** (yellow zone) and **strong demand below**, so expect:
* Fakeouts (liquidity grabs)
* Strong move after breakout
If you want, I can give you:
✔ Next expected move
✔ Buy/Sell bias
✔ SL/TP ideas based on your triangle
✔ Probability of breakout direction
Disclaimer
The information and publications are not meant to be, and do not constitute, financial, investment, trading, or other types of advice or recommendations supplied or endorsed by TradingView. Read more in the Terms of Use.
Disclaimer
The information and publications are not meant to be, and do not constitute, financial, investment, trading, or other types of advice or recommendations supplied or endorsed by TradingView. Read more in the Terms of Use.