🧈 GOLD | Teknik Harita
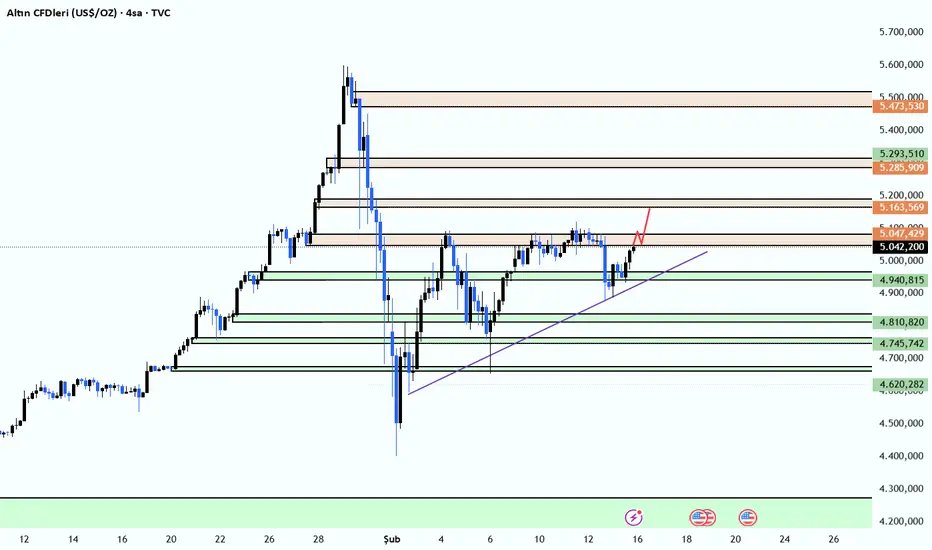
5.047 direncinden gelen tepki ile fiyatı yeniden 5.163 direnç alanına gidebilir. Bu bölge üzerinde tutunma sağlanırsa bir sonraki hedef 5.285 🎯
5.047 altı kapanışlarda ise baskı artabilir; 4.940 → 4.810 bandına geri çekilme ihtimali masada ⤵
Genel yapı pozitif. Kısa vadede kader noktası: 5.047 ⌛🧭
#NASDAQ100 #TeknikAnaliz #ForexMarket #endeks #GOLD #ALTIN #ALTINS1
Disclaimer
The information and publications are not meant to be, and do not constitute, financial, investment, trading, or other types of advice or recommendations supplied or endorsed by TradingView. Read more in the Terms of Use.
Disclaimer
The information and publications are not meant to be, and do not constitute, financial, investment, trading, or other types of advice or recommendations supplied or endorsed by TradingView. Read more in the Terms of Use.