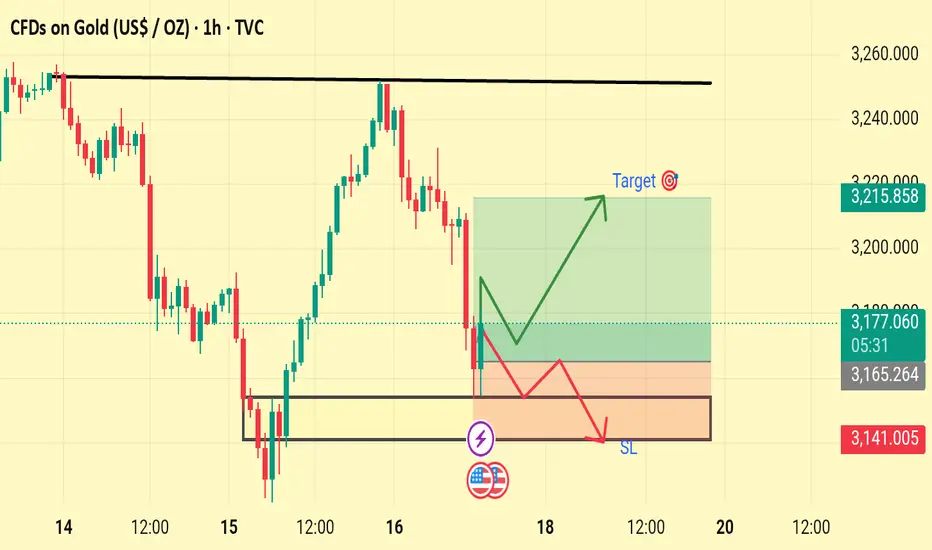
The image you uploaded is a TradingView chart for CFDs on Gold (XAU/USD) on the 1-hour timeframe.
Here’s a breakdown of the chart:
1. Price Movement: The chart shows a recent downtrend followed by a slight recovery.
2. Key Levels:
Target (Green Zone): Around the 3,215.858 mark, indicating a potential upward target.
Stop Loss (SL) (Red Zone): Around the 3,141.005 mark, suggesting a risk management level if the price moves downward.
3. Trade Setup:
Bullish Scenario: The green arrow indicates a potential buy trade aiming for the target zone if the price moves up.
Bearish Scenario: The red arrow indicates a potential sell trade if the price breaks below the support zone, heading towards the stop-loss level.
4. Market Sentiment: The chart reflects caution, with both bullish and bearish scenarios plotted. The decision likely hinges on whether the support level holds or breaks.
5. Indicators: The presence of flags (American and lightning bolt) might indicate significant economic events or news impacting the price.
Would you like an analysis of possible trading strategies based on this chart?
Trade closed: target reached
GOLD target 380 PIPS HIT Successfully Archived.t.me/TheMoneyPrinter_Mentorship
XAUUSD GOLD + BTCUSD Daily 5-6 Free Signals📊🚀
✅GOLD
✅BTC
✅EURUSD
✅USDJPY
TELEGRAM CHANNEL 👇🏻👇🏻👇🏻👇🏻👇🏻👇🏻
t.me/TheMoneyPrinter_Mentorship
XAUUSD GOLD + BTCUSD Daily 5-6 Free Signals📊🚀
✅GOLD
✅BTC
✅EURUSD
✅USDJPY
TELEGRAM CHANNEL 👇🏻👇🏻👇🏻👇🏻👇🏻👇🏻
t.me/TheMoneyPrinter_Mentorship
Disclaimer
The information and publications are not meant to be, and do not constitute, financial, investment, trading, or other types of advice or recommendations supplied or endorsed by TradingView. Read more in the Terms of Use.
t.me/TheMoneyPrinter_Mentorship
XAUUSD GOLD + BTCUSD Daily 5-6 Free Signals📊🚀
✅GOLD
✅BTC
✅EURUSD
✅USDJPY
TELEGRAM CHANNEL 👇🏻👇🏻👇🏻👇🏻👇🏻👇🏻
t.me/TheMoneyPrinter_Mentorship
XAUUSD GOLD + BTCUSD Daily 5-6 Free Signals📊🚀
✅GOLD
✅BTC
✅EURUSD
✅USDJPY
TELEGRAM CHANNEL 👇🏻👇🏻👇🏻👇🏻👇🏻👇🏻
t.me/TheMoneyPrinter_Mentorship
Disclaimer
The information and publications are not meant to be, and do not constitute, financial, investment, trading, or other types of advice or recommendations supplied or endorsed by TradingView. Read more in the Terms of Use.