Gold is edging back towards its April highs, pressing into a key resistance zone just as traders brace for another critical US jobs report this Friday. With the dollar under pressure and Donald Trump clashing with the Federal Reserve, gold is firmly in the spotlight this week.
Trump erodes dollar with central bank attack
Donald Trump’s latest clash with the Fed has taken a toll on the greenback. The decision to sack Fed governor Lisa Cook, combined with fresh attacks on chair Jay Powell, has fuelled concerns that central bank independence is being undermined. Markets reacted by pulling down short-term yields while bidding up the long end, steepening the curve in a way that has historically given gold an extra lift.
Attention now turns to Friday’s non-farm payrolls report. July’s data was weak, with only 73,000 jobs created and sizeable downward revisions to earlier months. That stumble pushed markets to start pricing a September rate cut, with traders now braced for August’s numbers to confirm or challenge that view. Economists are pencilling in a modest rebound, but the risk is tilted to the downside. Another miss would strengthen the case for near-term easing, keeping pressure on the dollar and giving gold a chance to test resistance. Stronger data, by contrast, could stall momentum and leave the metal struggling once again at the highs.
Technicals point to a pivotal test
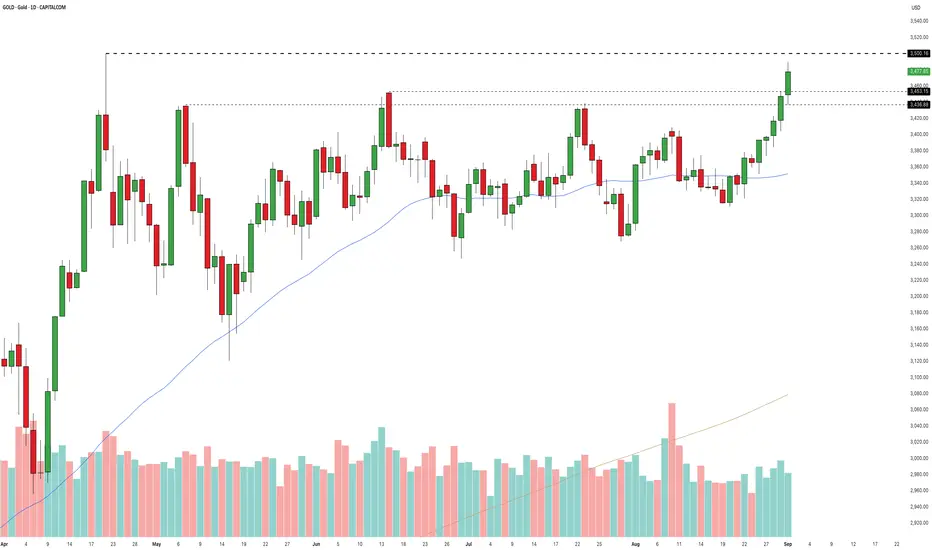
On the daily chart, gold has spent the summer grinding higher, with the 50-day moving average providing steady support. Price remains comfortably above the rising 200-day average, which keeps the broader uptrend intact. The latest push has carried the metal back into the resistance zone created by the April swing highs and reinforced by repeated peaks during the summer. Those April highs are the line in the sand. A clean break above would finally signal that the long summer consolidation is drawing to a close.
Gold Daily Candle Chart

Past performance is not a reliable indicator of future results
The weekly chart frames this even more clearly. After its powerful rally earlier in the year, gold settled into a wedge-shaped consolidation of narrowing highs and rising lows — essentially a coiled spring. The market is now pressing against the top of that wedge, leaving it on the verge of resolution. A weekly close above resistance would confirm the breakout and open the path to continuation of the long-term uptrend. A failure here, however, would extend the squeeze and test the patience of the bulls once again.
Gold Weekly Candle Chart

Past performance is not a reliable indicator of future results
Disclaimer: This is for information and learning purposes only. The information provided does not constitute investment advice nor take into account the individual financial circumstances or objectives of any investor. Any information that may be provided relating to past performance is not a reliable indicator of future results or performance. Social media channels are not relevant for UK residents.
Spread bets and CFDs are complex instruments and come with a high risk of losing money rapidly due to leverage. 82.78% of retail investor accounts lose money when trading spread bets and CFDs with this provider. You should consider whether you understand how spread bets and CFDs work and whether you can afford to take the high risk of losing your money.
Trump erodes dollar with central bank attack
Donald Trump’s latest clash with the Fed has taken a toll on the greenback. The decision to sack Fed governor Lisa Cook, combined with fresh attacks on chair Jay Powell, has fuelled concerns that central bank independence is being undermined. Markets reacted by pulling down short-term yields while bidding up the long end, steepening the curve in a way that has historically given gold an extra lift.
Attention now turns to Friday’s non-farm payrolls report. July’s data was weak, with only 73,000 jobs created and sizeable downward revisions to earlier months. That stumble pushed markets to start pricing a September rate cut, with traders now braced for August’s numbers to confirm or challenge that view. Economists are pencilling in a modest rebound, but the risk is tilted to the downside. Another miss would strengthen the case for near-term easing, keeping pressure on the dollar and giving gold a chance to test resistance. Stronger data, by contrast, could stall momentum and leave the metal struggling once again at the highs.
Technicals point to a pivotal test
On the daily chart, gold has spent the summer grinding higher, with the 50-day moving average providing steady support. Price remains comfortably above the rising 200-day average, which keeps the broader uptrend intact. The latest push has carried the metal back into the resistance zone created by the April swing highs and reinforced by repeated peaks during the summer. Those April highs are the line in the sand. A clean break above would finally signal that the long summer consolidation is drawing to a close.
Gold Daily Candle Chart
Past performance is not a reliable indicator of future results
The weekly chart frames this even more clearly. After its powerful rally earlier in the year, gold settled into a wedge-shaped consolidation of narrowing highs and rising lows — essentially a coiled spring. The market is now pressing against the top of that wedge, leaving it on the verge of resolution. A weekly close above resistance would confirm the breakout and open the path to continuation of the long-term uptrend. A failure here, however, would extend the squeeze and test the patience of the bulls once again.
Gold Weekly Candle Chart
Past performance is not a reliable indicator of future results
Disclaimer: This is for information and learning purposes only. The information provided does not constitute investment advice nor take into account the individual financial circumstances or objectives of any investor. Any information that may be provided relating to past performance is not a reliable indicator of future results or performance. Social media channels are not relevant for UK residents.
Spread bets and CFDs are complex instruments and come with a high risk of losing money rapidly due to leverage. 82.78% of retail investor accounts lose money when trading spread bets and CFDs with this provider. You should consider whether you understand how spread bets and CFDs work and whether you can afford to take the high risk of losing your money.
Disclaimer
The information and publications are not meant to be, and do not constitute, financial, investment, trading, or other types of advice or recommendations supplied or endorsed by TradingView. Read more in the Terms of Use.
Disclaimer
The information and publications are not meant to be, and do not constitute, financial, investment, trading, or other types of advice or recommendations supplied or endorsed by TradingView. Read more in the Terms of Use.