Gold Technical Analysis
Daily Resistance: 4380, Support: 3900
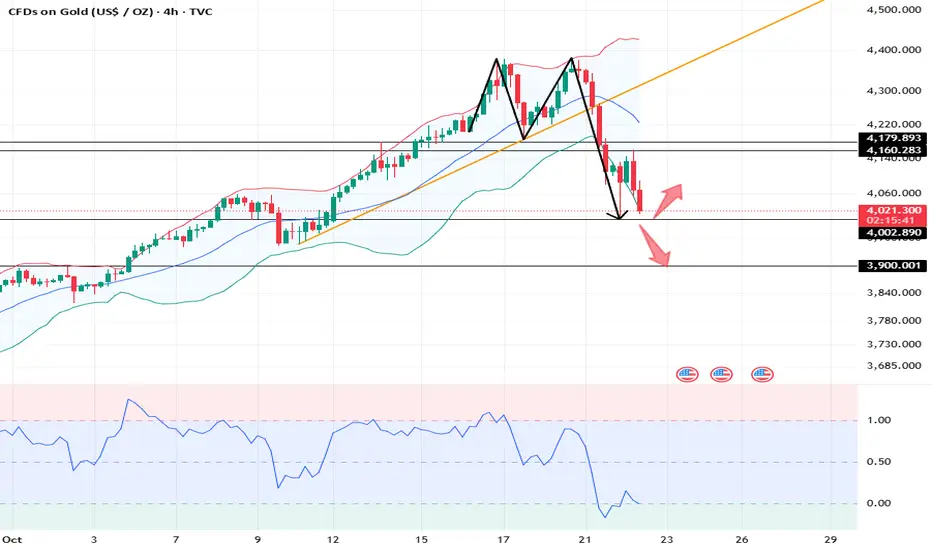
4-Hour Resistance: 4180, Support: 4000
1-Hour Resistance: 4160, Support: 4000
Technically, gold fell by $380, temporarily halting its decline near 4000. Technical indicators are recovering, and the market is taking a brief breather. Bull markets are prone to large swings, so it's unclear whether gold has truly reversed in the short term.
Gold has tested the 4000 support level twice. Watch for the continuation of the short-term downtrend. The moving average price has broken through the upward trend line in the short term, and the indicators are in a state of recovery, but the Bollinger Bands remain upward. The 4170/4180 levels on the daily chart are key. If they are successfully recaptured, the market is poised for a strong bullish resurgence. Otherwise, the market will continue to fluctuate downwards in the short term, looking for support. Focus on the 4000 level. If it breaks below, it will continue to move towards 3900.
Looking at the 1-hour chart, the candlestick pattern has broken below the neckline of the M-shaped top. Market bearish sentiment is being released, and indicators continue to move downward rapidly. The short-term bull-bear dividing line is between 4188 and 4208. Short-term rebound momentum is limited, and the NY market remains bearish.
Trading Strategy:
BUY: 4000-4005near
SELL: 4160near
SELL: 4178near
More Shares →
Daily Resistance: 4380, Support: 3900
4-Hour Resistance: 4180, Support: 4000
1-Hour Resistance: 4160, Support: 4000
Technically, gold fell by $380, temporarily halting its decline near 4000. Technical indicators are recovering, and the market is taking a brief breather. Bull markets are prone to large swings, so it's unclear whether gold has truly reversed in the short term.
Gold has tested the 4000 support level twice. Watch for the continuation of the short-term downtrend. The moving average price has broken through the upward trend line in the short term, and the indicators are in a state of recovery, but the Bollinger Bands remain upward. The 4170/4180 levels on the daily chart are key. If they are successfully recaptured, the market is poised for a strong bullish resurgence. Otherwise, the market will continue to fluctuate downwards in the short term, looking for support. Focus on the 4000 level. If it breaks below, it will continue to move towards 3900.
Looking at the 1-hour chart, the candlestick pattern has broken below the neckline of the M-shaped top. Market bearish sentiment is being released, and indicators continue to move downward rapidly. The short-term bull-bear dividing line is between 4188 and 4208. Short-term rebound momentum is limited, and the NY market remains bearish.
Trading Strategy:
BUY: 4000-4005near
SELL: 4160near
SELL: 4178near
More Shares →
Trade active
Starting from 4113.5, Sell! Sell! Sell! The direction is right.
💥Telegram Channel Free Updates 👉🏻
💥This a place for learning and communication. 👉🏻
💥Provide trading guidance.👉🏻
Telegram Channel👉🏻t.me/Actuary00group
💥This a place for learning and communication. 👉🏻
💥Provide trading guidance.👉🏻
Telegram Channel👉🏻t.me/Actuary00group
Disclaimer
The information and publications are not meant to be, and do not constitute, financial, investment, trading, or other types of advice or recommendations supplied or endorsed by TradingView. Read more in the Terms of Use.