🧩 Pattern Overview
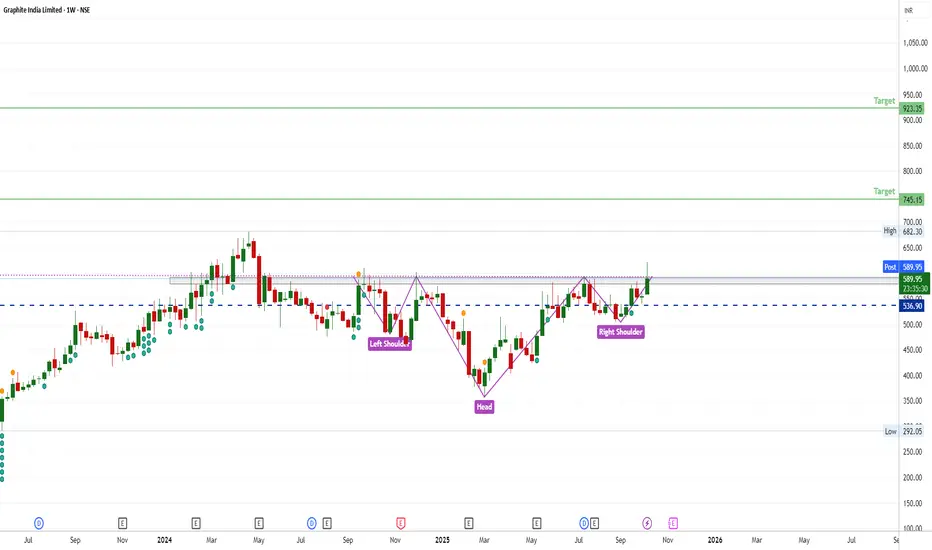
Left Shoulder: Formed when price fell from around ₹620 to ₹500, then bounced back.
Head: A deeper decline down to around ₹420 before recovering — marking the lowest point of the pattern.
Right Shoulder: A smaller dip to around ₹500 before price rose again.
Neckline: The resistance zone connecting the peaks between the shoulders (around ₹590–₹600).
📈 Current Situation
The price has just broken above the neckline (~₹590) — this confirms a bullish breakout of the inverse H&S pattern.
The breakout candle shows strong buying interest.
🎯 Target Projections
Target 1: ₹745 — conservative, measured from the neckline to head distance projected upward.
Target 2: ₹923 — extended target if momentum sustains.
🧠 Interpretation
The breakout suggests a shift from bearish to bullish trend.
Ideally, watch for a retest of neckline (₹590 zone). If it holds and price bounces, it strengthens the move.
Volume confirmation is key — strong volume on breakout adds reliability.
Disclaimer
The information and publications are not meant to be, and do not constitute, financial, investment, trading, or other types of advice or recommendations supplied or endorsed by TradingView. Read more in the Terms of Use.
Disclaimer
The information and publications are not meant to be, and do not constitute, financial, investment, trading, or other types of advice or recommendations supplied or endorsed by TradingView. Read more in the Terms of Use.