Fundamentals
Market cap: ~ ₹1.9-2.0 lakh Crore.
P/E Ratio: ~ ~45× (recent data).
PB Ratio: ~1.9-2.0×.
ROCE / ROE: Historically modest – ROCE ~5-6% in some published ratios.
Recent performance: It posted ~9% YoY growth in Q4 FY25 PAT (~₹1,496 crore) and declared a dividend.
The Economic Times
Strategic move: The company’s new paints business (“Birla Opus”) has become the second-largest player in India by capacity in its segment.
The Economic Times
Valuation note: Some sources suggest it may be overvalued relative to intrinsic value.
Smart Investing
Summary: Grasim is a large-cap diversified manufacturing company with multiple business verticals and some strategic expansion. However, returns and capital‐efficiency metrics are modest, and valuation is elevated for the growth achieved so far.
📈 Technical / Positional Setup
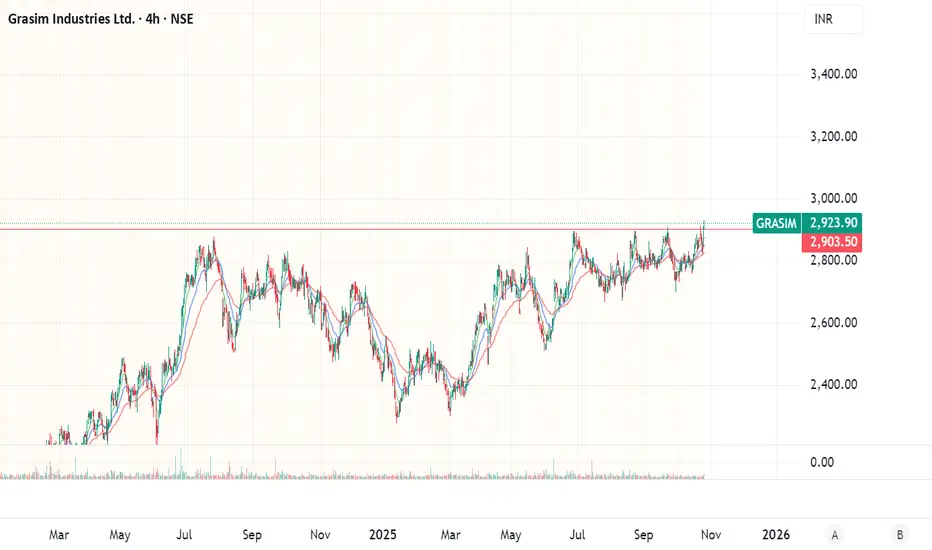
From the 4-hour chart you provided:
Price is trading around ~ ₹2,900+ region, nearing a resistance zone near ~ ₹2,900-₹3,000.
Recent price action indicates an attempt to break out above that zone.
Support zone is likely around the prior consolidation ~ ₹2,600-₹2,700.
Trend shows upside bias, but breakout needs confirmation (volume + close above resistance) for higher conviction.
Trade Plan:
Parameter Suggested Level / Zone
Entry Trigger A confirmed breakout and close above ~ ₹3,000-₹3,050
Stop-Loss Below recent support zone ~ ₹2,650-₹2,700
Target 1 ~ ₹3,300-₹3,450
Stretch Target 2 ~ ₹3,600+ (if momentum sustains)
If the price pulls back to support (~₹2,700-₹2,800) and shows reversal, that could be a safer “entry on dip” zone.
Because fundamentals aren’t high growth / high margin, keep position sizing moderate and be vigilant on breakout confirmation.
Volume confirmation and multi-timeframe alignment (daily + 4H) important for reliability.
Market cap: ~ ₹1.9-2.0 lakh Crore.
P/E Ratio: ~ ~45× (recent data).
PB Ratio: ~1.9-2.0×.
ROCE / ROE: Historically modest – ROCE ~5-6% in some published ratios.
Recent performance: It posted ~9% YoY growth in Q4 FY25 PAT (~₹1,496 crore) and declared a dividend.
The Economic Times
Strategic move: The company’s new paints business (“Birla Opus”) has become the second-largest player in India by capacity in its segment.
The Economic Times
Valuation note: Some sources suggest it may be overvalued relative to intrinsic value.
Smart Investing
Summary: Grasim is a large-cap diversified manufacturing company with multiple business verticals and some strategic expansion. However, returns and capital‐efficiency metrics are modest, and valuation is elevated for the growth achieved so far.
📈 Technical / Positional Setup
From the 4-hour chart you provided:
Price is trading around ~ ₹2,900+ region, nearing a resistance zone near ~ ₹2,900-₹3,000.
Recent price action indicates an attempt to break out above that zone.
Support zone is likely around the prior consolidation ~ ₹2,600-₹2,700.
Trend shows upside bias, but breakout needs confirmation (volume + close above resistance) for higher conviction.
Trade Plan:
Parameter Suggested Level / Zone
Entry Trigger A confirmed breakout and close above ~ ₹3,000-₹3,050
Stop-Loss Below recent support zone ~ ₹2,650-₹2,700
Target 1 ~ ₹3,300-₹3,450
Stretch Target 2 ~ ₹3,600+ (if momentum sustains)
If the price pulls back to support (~₹2,700-₹2,800) and shows reversal, that could be a safer “entry on dip” zone.
Because fundamentals aren’t high growth / high margin, keep position sizing moderate and be vigilant on breakout confirmation.
Volume confirmation and multi-timeframe alignment (daily + 4H) important for reliability.
Disclaimer
The information and publications are not meant to be, and do not constitute, financial, investment, trading, or other types of advice or recommendations supplied or endorsed by TradingView. Read more in the Terms of Use.
Disclaimer
The information and publications are not meant to be, and do not constitute, financial, investment, trading, or other types of advice or recommendations supplied or endorsed by TradingView. Read more in the Terms of Use.