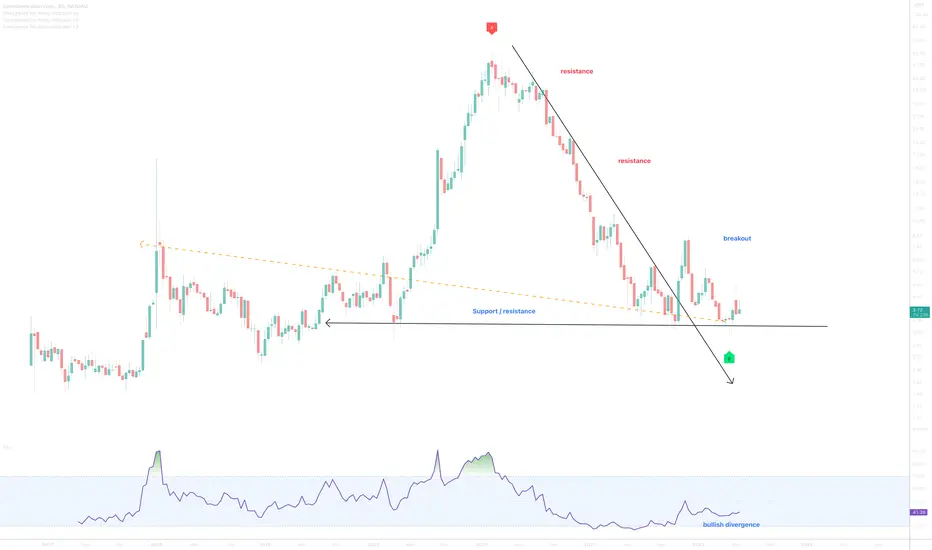
On the above 9-day chart price action has corrected 97% since the sell signal printed in February 2021. A number of reasons now exist to have a long position, including:
1) You know why..
2) Price action and RSI resistance breakouts.
3) Price action prints a double with higher lows in RSI.
4) Strong bullish divergence. Lots of it.
5) No stock splits.
Is it possible price action falls further? Sure.
Is it probable? No.
Ww
Type: investment
Risk: <=6% of portfolio
Timeframe: Will say elsewhere
Return: No idea
Stop loss: Will say elsewhere
Trade active
Past resistance confirmed as support.Note
support confirmed, againTrade active
Trade active
Past resistance confirms support.Disclaimer
The information and publications are not meant to be, and do not constitute, financial, investment, trading, or other types of advice or recommendations supplied or endorsed by TradingView. Read more in the Terms of Use.
Disclaimer
The information and publications are not meant to be, and do not constitute, financial, investment, trading, or other types of advice or recommendations supplied or endorsed by TradingView. Read more in the Terms of Use.