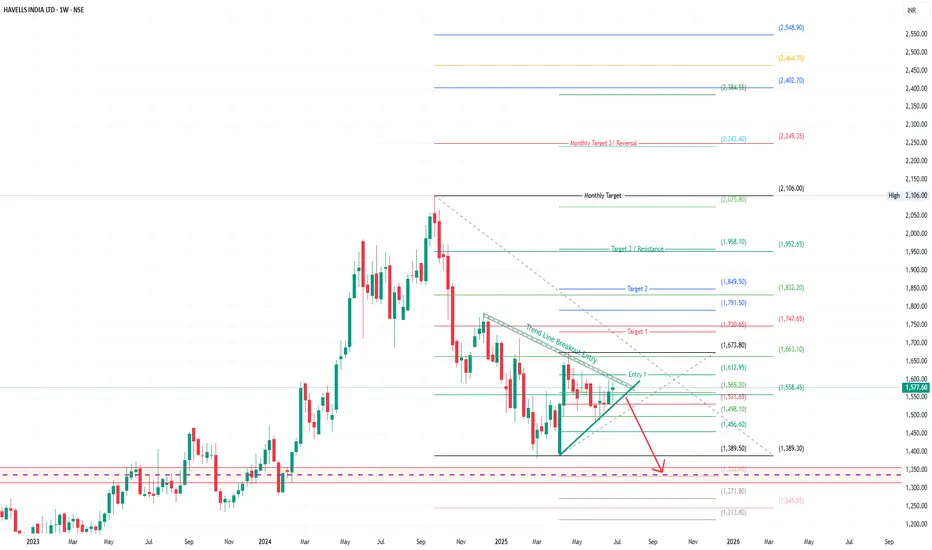
Havells India is showing signs of a falling wedge breakout on the weekly chart, a bullish reversal pattern often followed by sharp upside movement. The breakout appears near ₹1,565–1,612 zone, supported by a trendline breach and base formation.
This setup indicates strength if price sustains above the entry zone, with Fibonacci extensions pointing toward higher targets.
Key Technical Observations:
Pattern: Falling Wedge
Breakout Zone: ₹1,565–1,612
Monthly Target: ₹2,106
Volume: Increasing near breakout, adding credibility
Risk: Pullback toward ₹1,500 if resistance fails
Target Levels (Fibonacci Projections):
Target 1: ₹1,674
Target 2: ₹1,850
Target 3: ₹1,958
Monthly Target: ₹2,106
Extended Targets: ₹2,384 to ₹2,548
Invalidation Zone:
If price falls below ₹1,498 and breaks the wedge support again, the setup weakens.
Bearish Case: Breakdown may lead to ₹1,271 or even ₹1,213 in extreme cases.
Conclusion:
Watch for candle closing above ₹1,612 with volume confirmation. The trendline breakout setup offers a potential multi-leg rally if it sustains.
Disclaimer:
This technical analysis is for educational purposes only. Please consult a registered financial advisor before making investment decisions.
Note
SUBSCRIBE to @TheBreakoutAnalyst on YOUTUBE– your ultimate destination for sharp, real-time stock market insights! 📈 On this channel, we break down powerful breakout setups, provide BTST/STBT ideas, and deliver intraday trading strategies with clear technical analysis. Whether you're a beginner or a seasoned trader, @TheBreakoutAnalyst helps you stay ahead with actionable charts, timely updates, and no-fluff market breakdowns. Subscribe now and trade smarter every day! 💹Disclaimer
The information and publications are not meant to be, and do not constitute, financial, investment, trading, or other types of advice or recommendations supplied or endorsed by TradingView. Read more in the Terms of Use.
Disclaimer
The information and publications are not meant to be, and do not constitute, financial, investment, trading, or other types of advice or recommendations supplied or endorsed by TradingView. Read more in the Terms of Use.