# The Volume Void Ceiling: HBAR's Liquidity Desert Signal
## The Seller Stronghold Formation (Points 1→7)
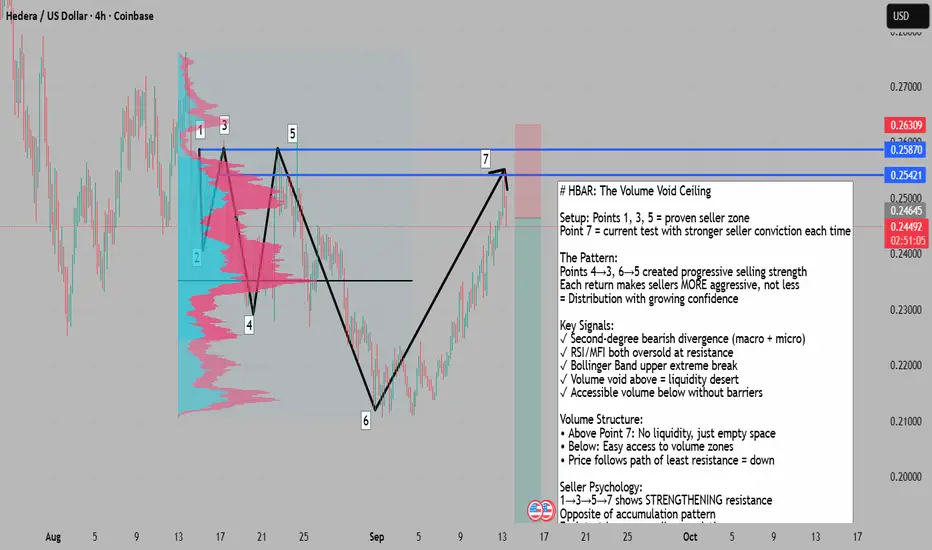
This isn't a simple resistance test - it's a progressive strengthening of seller conviction. Points 4 and 6 created Points 3 and 5 respectively as proven selling zones. Each return to the general resistance area shared by Points 1, 3, and 5 has made sellers more aggressive and confident. They increasingly view these levels as prime opportunities to exit longs or enter shorts.
## The Volume Void Phenomenon
Above Point 7 lies what I call a "liquidity desert" - a volume void where:
• No significant trading has occurred
• Price has no reason to linger
• Any move up would be purely transit to reach distant value areas
This void acts as a natural ceiling. Price won't explore these levels for liquidity because there is none. It would only pierce through rapidly if targeting much higher value zones - but with significant volume support below and resistance above, the path of least resistance is down.
## Second-Degree Divergence Signal
At Point 7, we observe:
• RSI/MFI: Both oversold
• Price: Testing resistance with bearish divergence
• Bar-level: Additional micro divergence
This creates a second-degree bearish divergence - a divergence within a divergence, suggesting multi-timeframe exhaustion.
## Bollinger Band Breakout Warning
Price is breaking the upper Bollinger Band extreme. This binary signal suggests either:
• Explosive continuation with extreme volatility
• Sharp reversal to the mean
Given the triple-tested resistance and volume void above, reversal probability dominates.
## The Accessibility Gradient
Looking at volume structure:
• Above: Volume void requires significant energy to traverse
• Below: Easily accessible volume without selling barriers
The market follows the path of least resistance. With liquidity readily available below but scarce above, gravity favors the downside.
## Progressive Seller Confidence
The pattern shows escalating seller strength:
• Point 1: Initial resistance
• Point 3: Confirmed resistance (after Point 4 low)
• Point 5: Reinforced resistance (after Point 6 low)
• Point 7: Maximum seller conviction
Each test hasn't weakened resistance - it's strengthened it, the opposite of typical accumulation.
## Risk Management Framework
Entry: Current levels (0.2458)
Stop Loss: Above resistance cluster (Points 1/3/5)
Initial Target: Point 6 support
Extended Target: Volume liquidity zones below
Position Advantages:
• Triple-tested, strengthening resistance
• Volume void ceiling above
• Second-degree divergence
• Clear risk definition
## The Technical Synthesis
This setup combines:
1. Progressive seller strengthening (not weakening)
2. Volume void creating natural ceiling
3. Multi-layer divergences
4. Statistical extremes (Bollinger pierce)
5. Liquidity gradient favoring downside
---
Bottom Line: When resistance strengthens with each test rather than weakens, when volume voids create ceilings above, and when multiple divergences align with statistical extremes, you're witnessing distribution at its most confident. The liquidity desert above ensures any upside would be violent and brief, while accessible volume below offers the path of least resistance.
## The Seller Stronghold Formation (Points 1→7)
This isn't a simple resistance test - it's a progressive strengthening of seller conviction. Points 4 and 6 created Points 3 and 5 respectively as proven selling zones. Each return to the general resistance area shared by Points 1, 3, and 5 has made sellers more aggressive and confident. They increasingly view these levels as prime opportunities to exit longs or enter shorts.
## The Volume Void Phenomenon
Above Point 7 lies what I call a "liquidity desert" - a volume void where:
• No significant trading has occurred
• Price has no reason to linger
• Any move up would be purely transit to reach distant value areas
This void acts as a natural ceiling. Price won't explore these levels for liquidity because there is none. It would only pierce through rapidly if targeting much higher value zones - but with significant volume support below and resistance above, the path of least resistance is down.
## Second-Degree Divergence Signal
At Point 7, we observe:
• RSI/MFI: Both oversold
• Price: Testing resistance with bearish divergence
• Bar-level: Additional micro divergence
This creates a second-degree bearish divergence - a divergence within a divergence, suggesting multi-timeframe exhaustion.
## Bollinger Band Breakout Warning
Price is breaking the upper Bollinger Band extreme. This binary signal suggests either:
• Explosive continuation with extreme volatility
• Sharp reversal to the mean
Given the triple-tested resistance and volume void above, reversal probability dominates.
## The Accessibility Gradient
Looking at volume structure:
• Above: Volume void requires significant energy to traverse
• Below: Easily accessible volume without selling barriers
The market follows the path of least resistance. With liquidity readily available below but scarce above, gravity favors the downside.
## Progressive Seller Confidence
The pattern shows escalating seller strength:
• Point 1: Initial resistance
• Point 3: Confirmed resistance (after Point 4 low)
• Point 5: Reinforced resistance (after Point 6 low)
• Point 7: Maximum seller conviction
Each test hasn't weakened resistance - it's strengthened it, the opposite of typical accumulation.
## Risk Management Framework
Entry: Current levels (0.2458)
Stop Loss: Above resistance cluster (Points 1/3/5)
Initial Target: Point 6 support
Extended Target: Volume liquidity zones below
Position Advantages:
• Triple-tested, strengthening resistance
• Volume void ceiling above
• Second-degree divergence
• Clear risk definition
## The Technical Synthesis
This setup combines:
1. Progressive seller strengthening (not weakening)
2. Volume void creating natural ceiling
3. Multi-layer divergences
4. Statistical extremes (Bollinger pierce)
5. Liquidity gradient favoring downside
---
Bottom Line: When resistance strengthens with each test rather than weakens, when volume voids create ceilings above, and when multiple divergences align with statistical extremes, you're witnessing distribution at its most confident. The liquidity desert above ensures any upside would be violent and brief, while accessible volume below offers the path of least resistance.
Note
forgot to double click screen to show my indicators rsi , mfi and obv as refrenced in the writing, grab chart and show indicators to see those.Join free public community + Indicator Access: t.me/+wzZdlyd93vkwMDRl
Disclaimer
The information and publications are not meant to be, and do not constitute, financial, investment, trading, or other types of advice or recommendations supplied or endorsed by TradingView. Read more in the Terms of Use.
Join free public community + Indicator Access: t.me/+wzZdlyd93vkwMDRl
Disclaimer
The information and publications are not meant to be, and do not constitute, financial, investment, trading, or other types of advice or recommendations supplied or endorsed by TradingView. Read more in the Terms of Use.