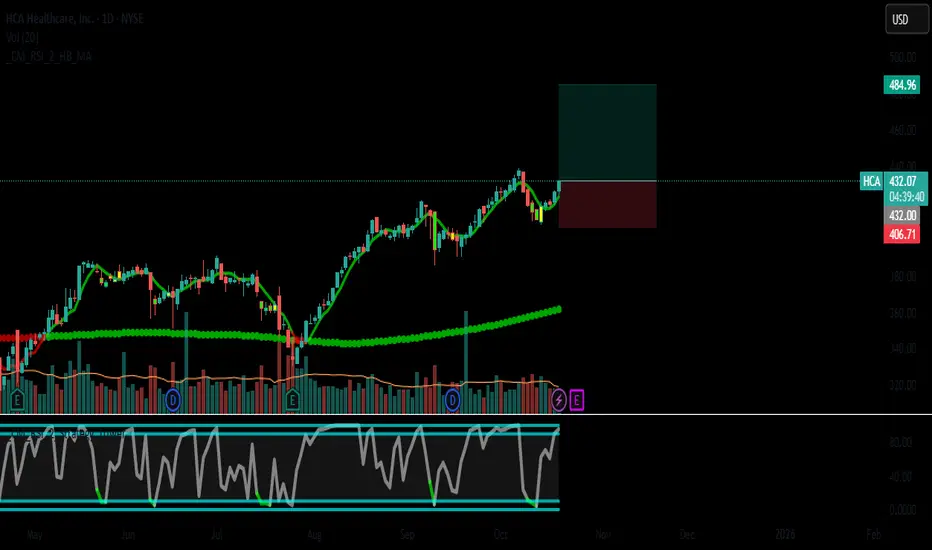
HCA - HCA Healthcare, Inc.
🏥 Strong Buy Signal | Confirmed by Fundamentals, Technicals & Connors RSI2
🎯 Trade Idea Overview
Direction: LONG
Entry Zone: $429 - $433
Stop Loss: $406.70
Take Profit: $484.96
Strategy: Swing to Position Trade (2–6 weeks)
Confidence Level: High (85%)
📊 Why HCA?
✅ Fundamental Strength (Score: 5/9)
Revenue Growth: Moderate 📈
Net Income Growth: Moderate 💹
Valuation: Fairly Valued (P/E 17.6)
Debt Health: Acceptable (Score: 7/10)
Sector Stability: Healthcare – Defensive Sector 🛡️
✅ Technical Alignment
Daily Trend: ✅ Bullish
4H Trend: ✅ Bullish
1H Trend: 🔁 Bearish (Short-term Pullback) → Ideal Entry Opportunity
Price Action: Trading near key support, poised for continuation
Momentum: Bullish structure intact across higher timeframes
✅ Connors RSI2 Confirmation
Buy Signal: Active on Oct 10 & 13 (Double Confirmation)
Strategy: RSI2 momentum shift + trend alignment
Timing: Signal remains valid within optimal 5-10 day window
📍 Entry & Risk Management
Recommended Entry: $431 (market or limit)
Stop Loss: $406.70 (5.6% risk)
Take Profit: $484.96 (12.5% reward)
R/R Ratio: 1:2.23 ✅
🧠 Trade Rationale
HCA presents a strong technical setup aligned with defensive sector strength.
Double Connors RSI2 buy signal (Oct 10 & 13) confirms short-term momentum shift.
Current pullback to $430 zone offers optimal risk/reward entry.
Healthcare sector provides stability during market uncertainty.
📆 Watch List
Monitor for bullish confirmation above $435.
Watch healthcare sector news and overall market sentiment.
Key earnings date: November (Q3 2025)
✅ Summary
Asset: HCA
Action: BUY
Entry: $431
SL: $406.70
TP: $484.96
Signal Type: Multi-timeframe + Double Connors RSI2 Confirmed
‼️ Disclaimer
This analysis is for informational purposes only and does not constitute financial advice or a recommendation to buy or sell any security. Trading involves substantial risk and is not suitable for every investor. You should carefully consider your investment objectives, experience level, and risk tolerance before acting on any information provided. The author is not a registered financial advisor and assumes no liability for any trading losses or damages resulting from this information. Past performance is not indicative of future results. Always conduct your own due diligence and consult with a qualified financial professional before making any investment decisions.
Disclaimer
The information and publications are not meant to be, and do not constitute, financial, investment, trading, or other types of advice or recommendations supplied or endorsed by TradingView. Read more in the Terms of Use.
Disclaimer
The information and publications are not meant to be, and do not constitute, financial, investment, trading, or other types of advice or recommendations supplied or endorsed by TradingView. Read more in the Terms of Use.