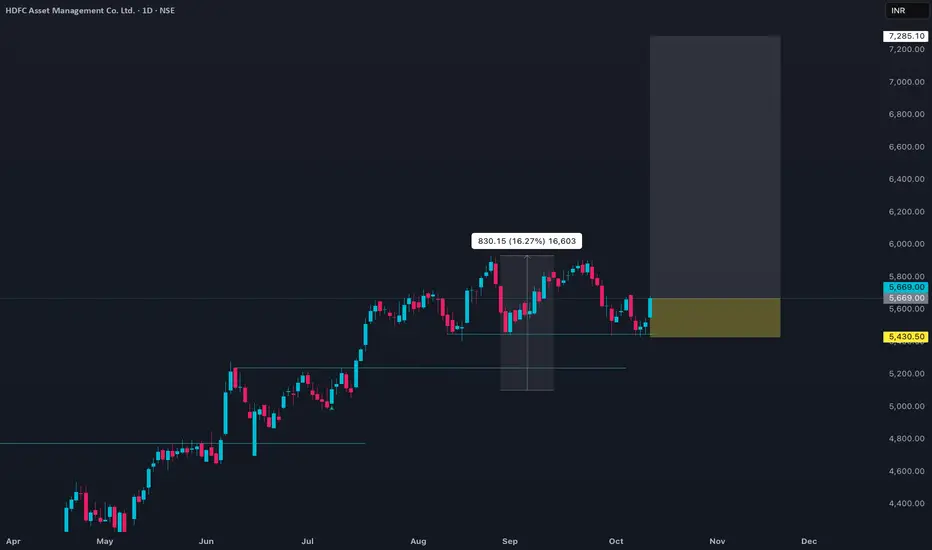
HDFC Asset Management Company Ltd (HDFCAMC) is currently trading around ₹5,669. The stock has recently advanced nearly 2.7% in a single day, with session lows near ₹5,550 and highs close to ₹5,684. Its 52-week range sits between ₹3,525 and ₹5,926, putting the current price near the upper end of its yearly band.
The company’s market capitalization is approximately ₹1,21,300 Crores. Average daily volume is around 12,000 shares, indicating reasonable liquidity for a large-cap stock. The stock holds a trailing P/E ratio of about 47, based on an EPS of ₹121, which is above the broader market average but within the range for premium asset management firms. The dividend yield is around 1.6%. Both 50-day and 200-day averages are close to ₹5,662 and ₹4,717, respectively, illustrating solid medium-term momentum.
Price trends show steady upward bias in 2025, with periodic pullbacks being well-supported and followed by new highs, reflecting investor confidence in HDFC AMC’s market potential, earnings consistency, and recent management initiatives such as a bonus share issue.HDFC Asset Management Company Ltd (HDFCAMC) is currently trading near ₹5,669, showing a strong recent uptrend with prices moving between ₹5,550 and ₹5,684 during the latest session. The 52-week range stands at approximately ₹3,525 to ₹5,926, placing the stock close to its yearly highs.
The company’s market cap is about ₹1,21,000 Crores. Its P/E ratio is around 47 (EPS of ₹121), which reflects a premium over broader market averages but is typical for the asset management sector. Recent daily volumes show consistent interest, and the 50-day and 200-day averages are ₹5,662 and ₹4,717, respectively, confirming a steady upward trend. The dividend yield is close to 1.6%.
Overall price momentum in 2025 remains positive, supported by strong institutional confidence, a track record of earnings growth, and optimism around management initiatives like bonus share announcements.
Related publications
Disclaimer
The information and publications are not meant to be, and do not constitute, financial, investment, trading, or other types of advice or recommendations supplied or endorsed by TradingView. Read more in the Terms of Use.
Related publications
Disclaimer
The information and publications are not meant to be, and do not constitute, financial, investment, trading, or other types of advice or recommendations supplied or endorsed by TradingView. Read more in the Terms of Use.