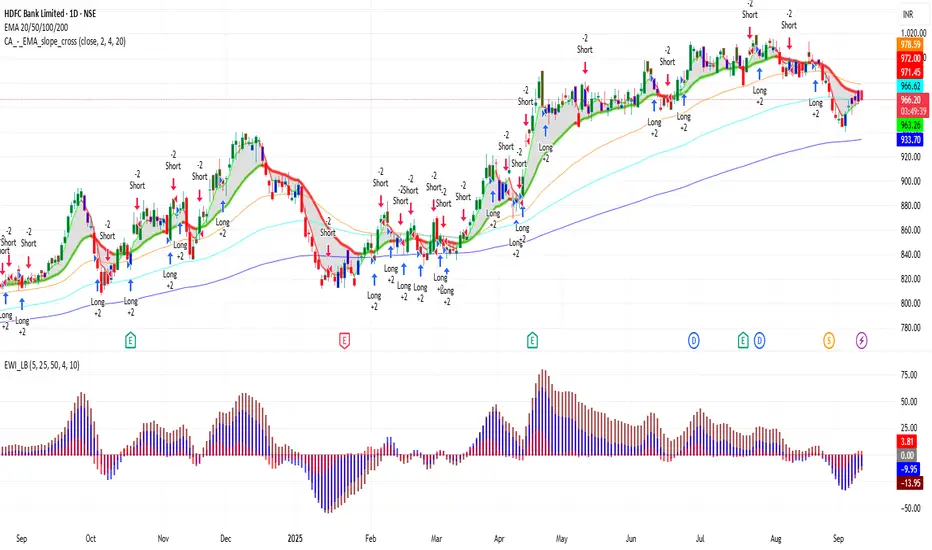
📍 HDFCBANK – 1D Important Levels (Current)
🔹 Support Zones
1,570 – 1,580 → Immediate daily support
1,530 – 1,550 → Strong support; buyers likely to defend this zone
1,480 – 1,500 → Major support; breakdown may shift trend bearish
🔹 Resistance Zones
1,620 – 1,630 → Immediate daily resistance
1,660 – 1,680 → Strong resistance zone
1,720 – 1,740 → Major resistance; breakout here may trigger a bigger rally
⚖️ Daily Trend Outlook
HDFC Bank is currently in a sideways-to-bullish phase on the daily chart.
As long as price holds above 1,570, momentum can stay positive.
A breakout above 1,630 – 1,680 may extend upside towards 1,720 – 1,740.
A breakdown below 1,570 could drag it back to 1,530 – 1,500.
Related publications
Disclaimer
The information and publications are not meant to be, and do not constitute, financial, investment, trading, or other types of advice or recommendations supplied or endorsed by TradingView. Read more in the Terms of Use.
Related publications
Disclaimer
The information and publications are not meant to be, and do not constitute, financial, investment, trading, or other types of advice or recommendations supplied or endorsed by TradingView. Read more in the Terms of Use.