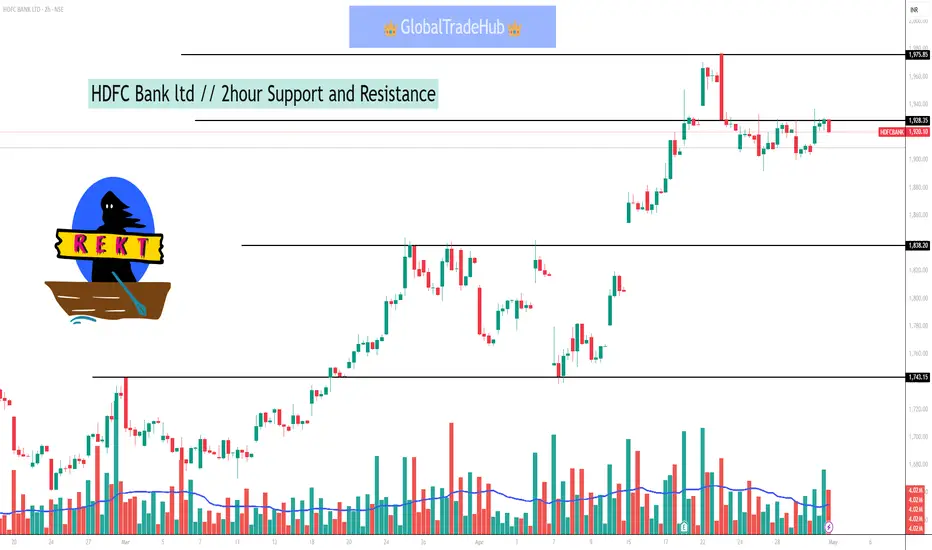
As of May 1, 2025, at 9:58 AM IST, HDFC Bank Ltd (NSE: HDFCBANK) is trading at ₹1,765. Based on recent technical analysis, here are the key support and resistance levels for the stock on a 2-hour (2H) chart:
📊 2-Hour Support and Resistance Levels
Immediate Support Levels:
₹1,746
₹1,732
Immediate Resistance Levels:
₹1,797
₹1,812
These levels suggest that if the stock price falls below the immediate support at ₹1,746, it may find the next support at ₹1,732. Conversely, if the price rises above the immediate resistance at ₹1,797, it could encounter the next resistance at ₹1,812 .
📉 Technical Indicators
ADX (Average Directional Index): 24.08, indicating a trending market.
MACD (Moving Average Convergence Divergence): Bearish crossover detected, suggesting downward momentum.
Parabolic SAR: Positioned at ₹1,714.70, indicating a bearish trend.
Super Trend: At ₹1,728.41, confirming bearish sentiment.
Bollinger Bands: Price is below the middle band (₹1,707.66), indicating potential for further downside .
Related publications
Disclaimer
The information and publications are not meant to be, and do not constitute, financial, investment, trading, or other types of advice or recommendations supplied or endorsed by TradingView. Read more in the Terms of Use.
Related publications
Disclaimer
The information and publications are not meant to be, and do not constitute, financial, investment, trading, or other types of advice or recommendations supplied or endorsed by TradingView. Read more in the Terms of Use.