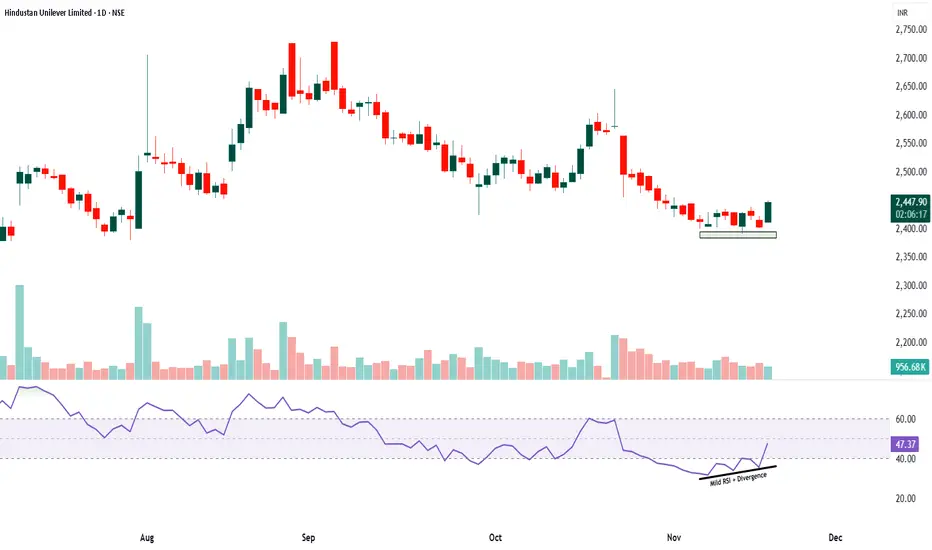
The chart shows a mild RSI divergence where the price made a lower low near the 2400 zone while RSI formed a higher low, indicating that the selling momentum is reducing even though the price slipped slightly. This zone also aligns with a strong weekly support area where the stock has earlier taken reversal, adding more weight to the possibility of a bounce from this level. Volumes have remained on the lower side during the recent fall, suggesting that the decline was not driven by strong selling pressure. The latest green candle near support with improving RSI momentum indicates that buyers are slowly stepping in.
A possible trade plan can be to take entry above 2460 once the price shows continued strength. A safe stop loss can be placed below 2385, just under the weekly support zone. The first target can be around 2520, where minor resistance exists, and the second target can be around 2580 if momentum continues to build. This setup works best if RSI moves above 50 and volumes start rising on bullish candles. This is for educational purposes only.
A possible trade plan can be to take entry above 2460 once the price shows continued strength. A safe stop loss can be placed below 2385, just under the weekly support zone. The first target can be around 2520, where minor resistance exists, and the second target can be around 2580 if momentum continues to build. This setup works best if RSI moves above 50 and volumes start rising on bullish candles. This is for educational purposes only.
Disclaimer
The information and publications are not meant to be, and do not constitute, financial, investment, trading, or other types of advice or recommendations supplied or endorsed by TradingView. Read more in the Terms of Use.
Disclaimer
The information and publications are not meant to be, and do not constitute, financial, investment, trading, or other types of advice or recommendations supplied or endorsed by TradingView. Read more in the Terms of Use.