Current Situation:
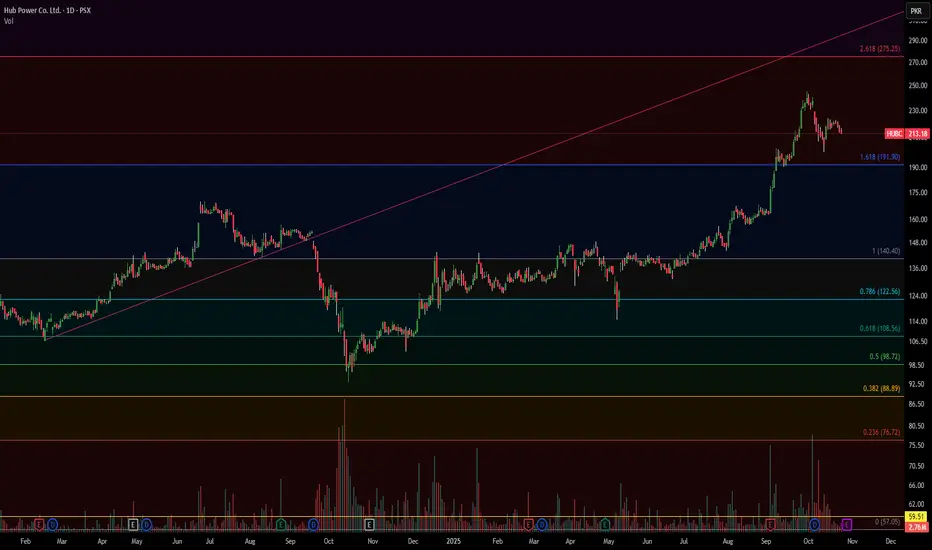
Price: 213.18 PKR, down 0.68%
The stock is in a correction phase after a parabolic rally to 250+ in October
Key Technical Observations:
Trend Structure:
Strong uptrend from August-October 2025, breaking above long-term resistance
Currently pulling back after reaching the 1.618 Fibonacci extension (275.25)
Price rejected at the red diagonal resistance trendline
Fibonacci Retracement Levels (from recent rally):
0.236 (76.72): Extreme support - major breakdown level
0.382 (86.89): Deep correction zone
0.5 (98.72): Half retracement
0.618 (108.56): Strong support zone ✓
0.786 (132.56): Current battle zone - KEY LEVEL
1.0 (140.40): Previous resistance, now support
Critical Support/Resistance:
Support:
Immediate: 210-213 (current price action)
Strong: 191-195 (1.618 Fib + psychological level)
Major: 140-145 (1.0 Fib + previous resistance turned support)
Critical: 132 (0.786 Fib)
Resistance:
Immediate: 220-225 (short-term)
Strong: 240-245 (recent highs)
Major: 250-255 (all-time high zone)
Volume Analysis:
Multiple volume spikes throughout the chart (circled)
Recent volume elevated but declining - suggests weakening buying pressure
Distribution pattern forming at the top
Pattern Recognition:
Potential rising wedge/parabolic blow-off top pattern
Red trendline acting as dynamic resistance
Price struggling to hold above the 1.618 Fib level (191.90)
Technical Outlook:
Bearish Scenario (Higher Probability):
If 210 breaks, expect a move toward 191-195 zone
Break below 191 could trigger deeper correction to 140-145 (30% pullback)
The parabolic nature of the rally suggests a significant retracement is likely
Bullish Scenario:
Needs to reclaim and hold above 220-225 with volume
Break above 240 would invalidate the correction and resume uptrend
Target: Retest of 250-260 highs
Trading Strategy:
Short-term: Bearish - avoid catching falling knives
Watch for support at 191-195 for potential bounce
Conservative buyers should wait for stabilization around 140-150 zone
Stop loss for any long positions: Below 190
Risk Assessment: The steep rally suggests profit-taking pressure. The stock may need time to consolidate before the next leg up. Be cautious of FOMO buying at current levels.
Related publications
Disclaimer
The information and publications are not meant to be, and do not constitute, financial, investment, trading, or other types of advice or recommendations supplied or endorsed by TradingView. Read more in the Terms of Use.
Related publications
Disclaimer
The information and publications are not meant to be, and do not constitute, financial, investment, trading, or other types of advice or recommendations supplied or endorsed by TradingView. Read more in the Terms of Use.