IDFC First Bank – Daily Chart Analysis
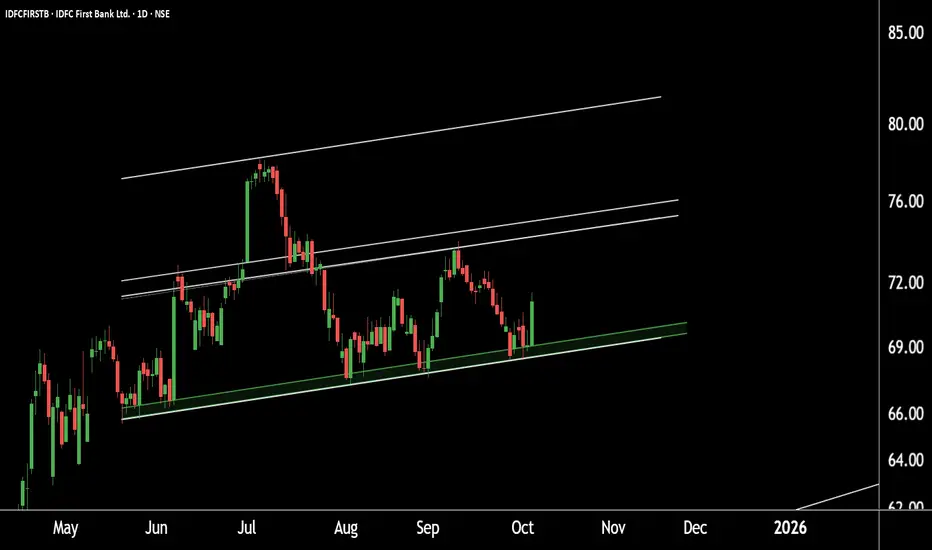
Timeframe: Daily chart observation.
Price Structure: The stock is trading within a well-defined parallel channel.
Support Zone: Strong support identified near the ₹67–₹69 range.
Upside Target: If the support zone holds, the next potential upside target lies around ₹81–₹82.
Outlook: Sustaining above the support levels may lead to higher prices in the upcoming sessions.
Thank you.
@RahulSaraoge
Connect us at t.me/stridesadvisory
Connect us at t.me/stridesadvisory
Disclaimer
The information and publications are not meant to be, and do not constitute, financial, investment, trading, or other types of advice or recommendations supplied or endorsed by TradingView. Read more in the Terms of Use.