STOCK Daily Time Frame Reversal On Support
1. Price Action
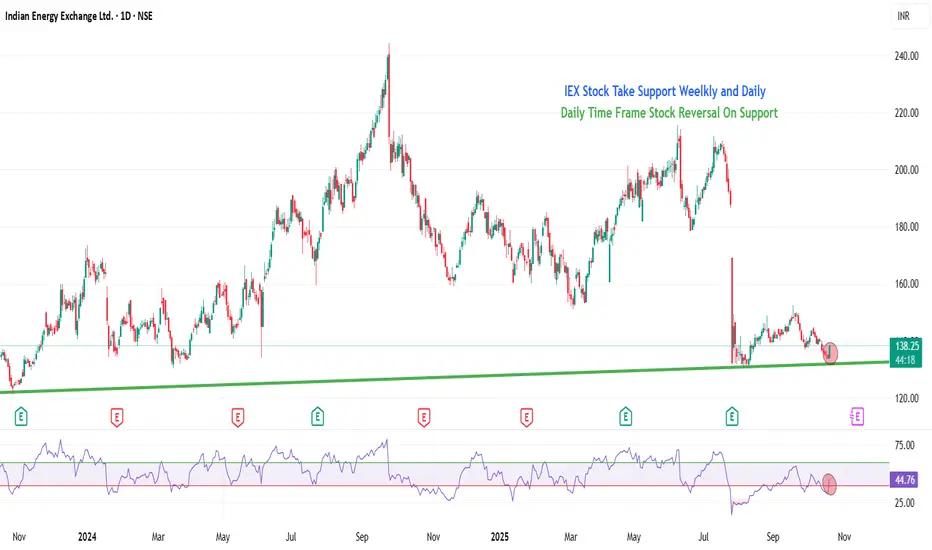
The stock is trading around 138, which is exactly at its 52-week low and a historical support zone from 2021.
Bullish Candle Stick Patterns is forming at support.
2. RSI (Relative Strength Index)
RSI at 44 → has moved from oversold to buying zone.
5. Support and Resistance
Immediate support: 134 (current zone). This Support will act as our stop loss.
Upside swing targets: ₹170 → ₹210
Note: This chart is for study and educational purposes only. Not a trade recommendation. Please do your own analysis and risk assessment before taking any action.
Disclaimer
The information and publications are not meant to be, and do not constitute, financial, investment, trading, or other types of advice or recommendations.
1. Price Action
The stock is trading around 138, which is exactly at its 52-week low and a historical support zone from 2021.
Bullish Candle Stick Patterns is forming at support.
2. RSI (Relative Strength Index)
RSI at 44 → has moved from oversold to buying zone.
5. Support and Resistance
Immediate support: 134 (current zone). This Support will act as our stop loss.
Upside swing targets: ₹170 → ₹210
Note: This chart is for study and educational purposes only. Not a trade recommendation. Please do your own analysis and risk assessment before taking any action.
Disclaimer
The information and publications are not meant to be, and do not constitute, financial, investment, trading, or other types of advice or recommendations.
Hari Pratap
Related publications
Disclaimer
The information and publications are not meant to be, and do not constitute, financial, investment, trading, or other types of advice or recommendations supplied or endorsed by TradingView. Read more in the Terms of Use.
Hari Pratap
Related publications
Disclaimer
The information and publications are not meant to be, and do not constitute, financial, investment, trading, or other types of advice or recommendations supplied or endorsed by TradingView. Read more in the Terms of Use.