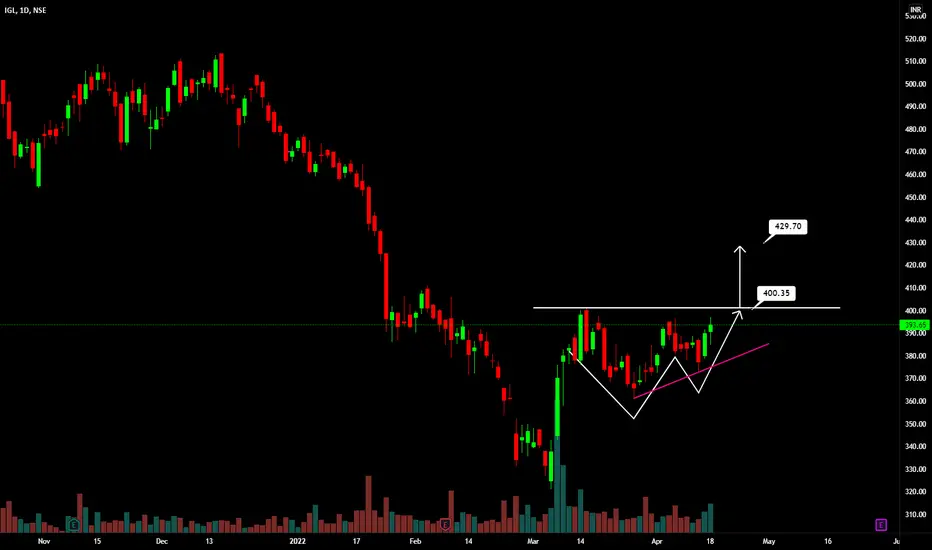
Above chart is a daily chart of IGL.
Double bottom pattern with higher low is visible.
Breaking above 400 will active the trade.
Potential target 430.
Double bottom pattern with higher low is visible.
Breaking above 400 will active the trade.
Potential target 430.
Disclaimer
The information and publications are not meant to be, and do not constitute, financial, investment, trading, or other types of advice or recommendations supplied or endorsed by TradingView. Read more in the Terms of Use.
Disclaimer
The information and publications are not meant to be, and do not constitute, financial, investment, trading, or other types of advice or recommendations supplied or endorsed by TradingView. Read more in the Terms of Use.