Asset: IIFL Capital Services Ltd (IIFLCAPS)
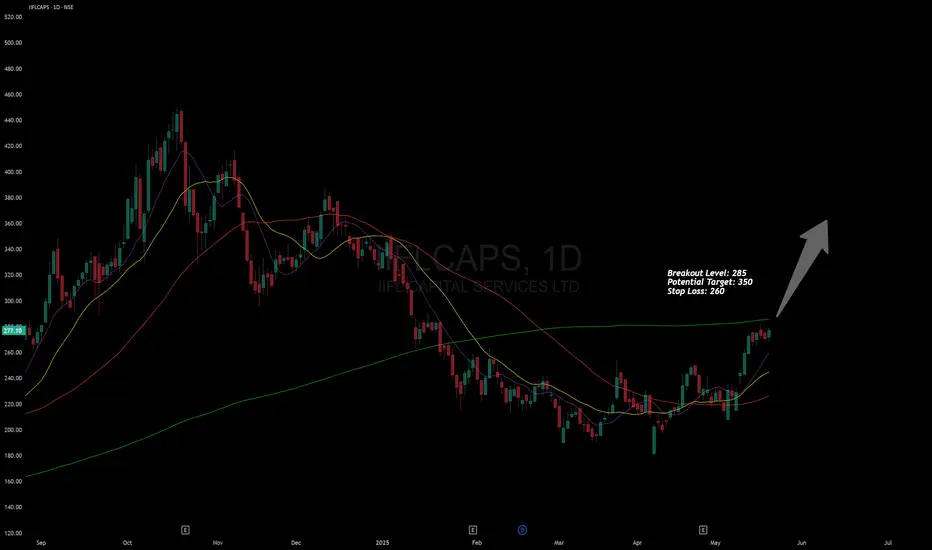
Breakout Level: 285
Potential Target: 350
Stop Loss: 260
Timeframe: Short to Medium term
Risk to Reward ratio : 1:3 (conservative)
Rationale:
Fundamentals -
Fundamentally decent stock with the following attributes:
* ROCE - 34.6%
* ROE - 33.2%
* Debt to Equity - 0.37
* Stock PE 12 / Industry PE - 15 || Stock PBV 3.44 / Industry PBV 1.98 - Company is slightly overpriced
* EPS / Revenue - Increasing over last 6 months
Technicals -
* Overall structure - Cup and Handle / The price is presently forming the handle
* Multiple timeframe analysis - Stock poised for up move
* Stock respects 10 DMA and 10 DMA is surfing seamlessly above 20 DMA
* Increasing momentum / RS
* ADR 5.8% / seeing some sluggishness
Market analysis
* Volatile
* Promoter holding is steady
* MFs and FIIs - slight decline
* DIIs - increasing
Cons
* Slow growth
This analysis is for educational purposes only and should not be considered as financial advice. Trading and investing in financial markets involve significant risk, and past performance is not indicative of future results. You should conduct your own research and consult with a qualified financial advisor before making any trading or investment decisions. The author is not responsible for any financial losses or damages that may result from the use of this information.
Trade active
Shot up by ~7.5%Note
Now breached it 200 DMA ceiling. We can expect some more movement as the finance sector is going good.Disclaimer
The information and publications are not meant to be, and do not constitute, financial, investment, trading, or other types of advice or recommendations supplied or endorsed by TradingView. Read more in the Terms of Use.
Disclaimer
The information and publications are not meant to be, and do not constitute, financial, investment, trading, or other types of advice or recommendations supplied or endorsed by TradingView. Read more in the Terms of Use.