Key Technical Indicators:
Oscillators: Neutral
Moving Averages: Strong Buy
Overall Technical Rating: Neutral
Support and Resistance Levels:
Weekly Pivot Points:
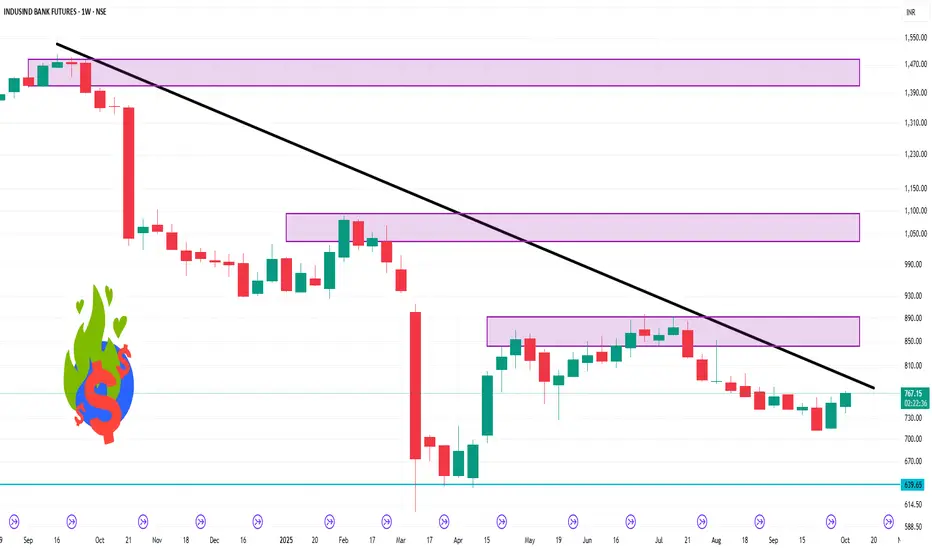
Support: 739.63
Resistance: 766.72
Additional Insights:
Relative Strength Index (RSI): The 14-day RSI is at 70.368, suggesting the stock is approaching overbought conditions, which may indicate a potential pullback
Moving Averages: The 5-day moving average is 755.54, and the 50-day moving average is 744.63, both indicating a bullish trend
Conclusion:
While the overall technical rating is neutral, the price action above the weekly pivot point and the bullish moving averages suggest a potential for upward movement. However, the elevated RSI indicates caution, as the stock may be due for a correction. Traders should monitor these levels closely and consider the broader market conditions before making trading decisions.
Oscillators: Neutral
Moving Averages: Strong Buy
Overall Technical Rating: Neutral
Support and Resistance Levels:
Weekly Pivot Points:
Support: 739.63
Resistance: 766.72
Additional Insights:
Relative Strength Index (RSI): The 14-day RSI is at 70.368, suggesting the stock is approaching overbought conditions, which may indicate a potential pullback
Moving Averages: The 5-day moving average is 755.54, and the 50-day moving average is 744.63, both indicating a bullish trend
Conclusion:
While the overall technical rating is neutral, the price action above the weekly pivot point and the bullish moving averages suggest a potential for upward movement. However, the elevated RSI indicates caution, as the stock may be due for a correction. Traders should monitor these levels closely and consider the broader market conditions before making trading decisions.
Related publications
Disclaimer
The information and publications are not meant to be, and do not constitute, financial, investment, trading, or other types of advice or recommendations supplied or endorsed by TradingView. Read more in the Terms of Use.
Related publications
Disclaimer
The information and publications are not meant to be, and do not constitute, financial, investment, trading, or other types of advice or recommendations supplied or endorsed by TradingView. Read more in the Terms of Use.