Chart Overview
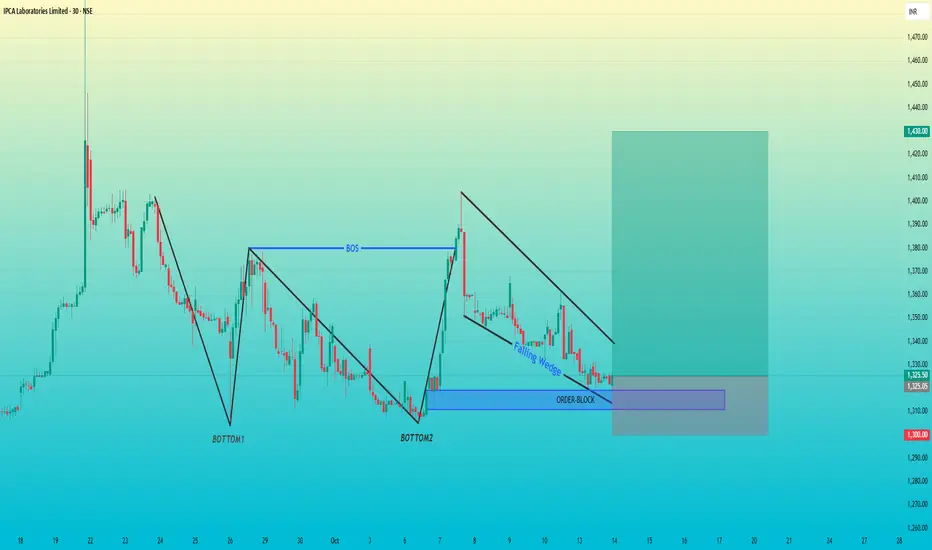
Pattern: Falling Wedge inside a confirmed bullish structure
Structure Break: BOS (Break of Structure) already confirmed
Key Levels:
Order Block Zone: Around ₹1300–₹1310
Current Price: ₹1325
Target Zone: ₹1430
Stop-Loss: Below ₹1300
Technical Breakdown
1. Double Bottom
The formation of Bottom1 and Bottom2 shows a strong demand base.
The BOS (Break of Structure) after Bottom2 confirms that buyers took control.
2. Falling Wedge Pattern
After the BOS, the price is consolidating in a Falling Wedge, which is typically a bullish continuation pattern.
Price respecting the wedge boundaries suggests compression — a breakout to the upside can trigger momentum.
3. Order Block Zone
The blue rectangular area marks a bullish order block from the last strong bullish rally.
Price has retraced back into this OB, creating an ideal entry point if bullish rejection appears.
4. Trade Setup
Entry: Near ₹1320–₹1325
Stop-Loss: Below ₹1300 (OB invalidation)
Target: ₹1430
RR Ratio: ≈ 1:4
Trade closed: stop reached
For more live trades
join t.me/vedindicator
The reason behind Orderblock (Free Trial)
Visit- vedindicator.com
join t.me/vedindicator
The reason behind Orderblock (Free Trial)
Visit- vedindicator.com
Disclaimer
The information and publications are not meant to be, and do not constitute, financial, investment, trading, or other types of advice or recommendations supplied or endorsed by TradingView. Read more in the Terms of Use.