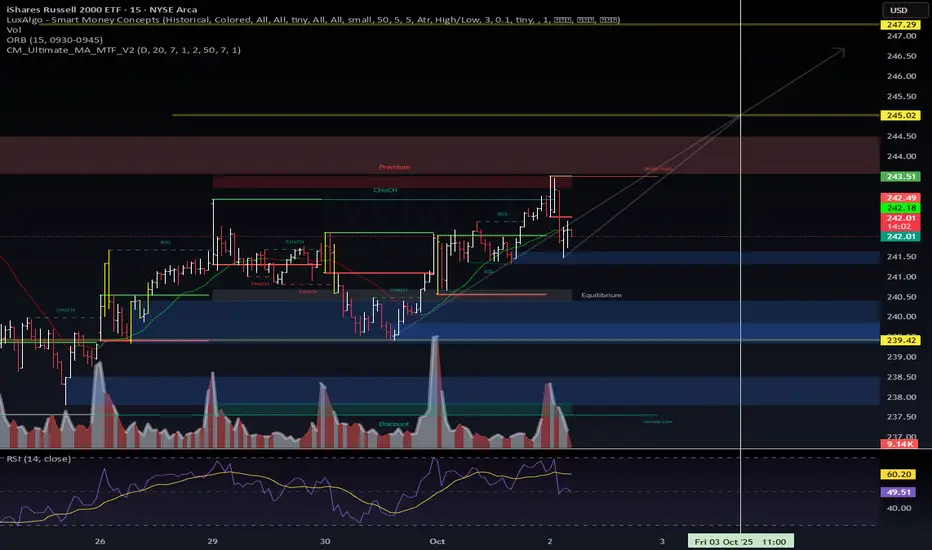
🟢  IWM | Russell 2000 – Intraday Structure Map
📊 Setup
Price respected the discount zone and reclaimed equilibrium.
Current rejection at premium zone (243.5) → marking liquidity grab / weak high.
RSI cooling off from 60+ levels, suggesting consolidation before next leg.
🧩 Market Structure
Multiple CHOCH & BOS signals confirm active rotation.
Higher-timeframe bias supports a possible impulse extension.
Watching wave (3) → (5) projection toward 245.0–247.2 zone.
🎯 Scenarios
Bullish Case (Primary):
Hold >242.0 → reclaim 243.5 → push to 245.0, extension 247.2.
Bearish Case (Alternate):
Fail to hold 242.0 → revisit equilibrium/demand around 239.4.
📌 Summary
IWM is building an intraday impulse wave count. Holding above 242.0 keeps the bull case intact with 245–247 in sight. Break below 241.8 flips bias back to demand re-test.
📊 Setup
Price respected the discount zone and reclaimed equilibrium.
Current rejection at premium zone (243.5) → marking liquidity grab / weak high.
RSI cooling off from 60+ levels, suggesting consolidation before next leg.
🧩 Market Structure
Multiple CHOCH & BOS signals confirm active rotation.
Higher-timeframe bias supports a possible impulse extension.
Watching wave (3) → (5) projection toward 245.0–247.2 zone.
🎯 Scenarios
Bullish Case (Primary):
Hold >242.0 → reclaim 243.5 → push to 245.0, extension 247.2.
Bearish Case (Alternate):
Fail to hold 242.0 → revisit equilibrium/demand around 239.4.
📌 Summary
WaverVanir ⚡ To grow and conquer
stocktwits.com/WaverVanir | wavervanir.com | buymeacoffee.com/wavervanir
Not Investment Advice
stocktwits.com/WaverVanir | wavervanir.com | buymeacoffee.com/wavervanir
Not Investment Advice
Disclaimer
The information and publications are not meant to be, and do not constitute, financial, investment, trading, or other types of advice or recommendations supplied or endorsed by TradingView. Read more in the Terms of Use.