📊 Trade Context
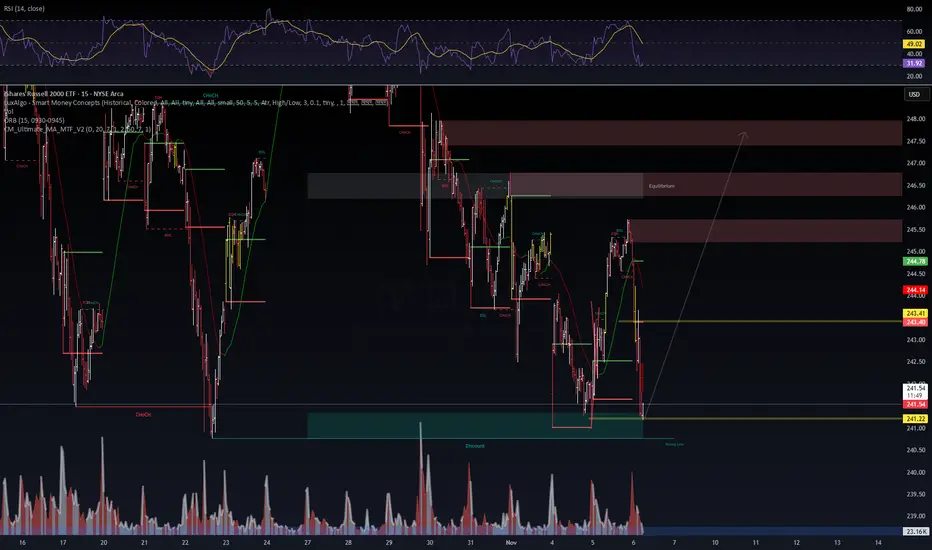
Symbol: IWM (Russell 2000 ETF)
Timeframe: 15-minute
Current Price Zone: $241.20–$241.40
Structure: Clear BOS (Break of Structure) → CHoCH (Change of Character) → Discount zone retest.
RSI: ~29 (oversold), showing early divergence potential.
⚙️ Setup Breakdown
Discount Zone: The green zone marks a liquidity sweep and potential “strong low.”
Confluence:
Volume spike at discount (buyer absorption).
RSI divergence (momentum exhaustion on the downside).
Structural sweep of previous equal lows.
Immediate Resistance: $243.40 → minor supply zone.
Main Target Zone: $246.00–$247.50 (equilibrium and prior inefficiency zone).
🧠 Trade Thesis
Buyers are defending the discount region around $241.00.
Expectation: Liquidity grab → reaccumulation → move toward equilibrium.
Entry: Around $241.20 (discount reaction confirmed with bullish candle).
Stop-loss: Below $240.70 (invalidate if lower low forms).
Take-profit:
TP1: $243.40 (intraframe supply)
TP2: $246.40 (equilibrium)
TP3: $247.50 (full mitigation zone)
🕹️ Execution Plan
Wait for bullish confirmation on smaller timeframes (M5–M1 BOS/CHoCH).
Use reduced size at entry; scale as momentum confirms.
Watch RSI reclaim above 40 — it usually aligns with structural reversal.
⚠️ Risk and Management
Risk/Reward ~1:3.5 (optimal under current volatility).
Avoid adding below $241.00 — zone invalidates below $240.70.
Volume must increase on breakout above $243.40; otherwise, partial exit recommended.
Symbol:
Timeframe: 15-minute
Current Price Zone: $241.20–$241.40
Structure: Clear BOS (Break of Structure) → CHoCH (Change of Character) → Discount zone retest.
RSI: ~29 (oversold), showing early divergence potential.
⚙️ Setup Breakdown
Discount Zone: The green zone marks a liquidity sweep and potential “strong low.”
Confluence:
Volume spike at discount (buyer absorption).
RSI divergence (momentum exhaustion on the downside).
Structural sweep of previous equal lows.
Immediate Resistance: $243.40 → minor supply zone.
Main Target Zone: $246.00–$247.50 (equilibrium and prior inefficiency zone).
🧠 Trade Thesis
Buyers are defending the discount region around $241.00.
Expectation: Liquidity grab → reaccumulation → move toward equilibrium.
Entry: Around $241.20 (discount reaction confirmed with bullish candle).
Stop-loss: Below $240.70 (invalidate if lower low forms).
Take-profit:
TP1: $243.40 (intraframe supply)
TP2: $246.40 (equilibrium)
TP3: $247.50 (full mitigation zone)
🕹️ Execution Plan
Wait for bullish confirmation on smaller timeframes (M5–M1 BOS/CHoCH).
Use reduced size at entry; scale as momentum confirms.
Watch RSI reclaim above 40 — it usually aligns with structural reversal.
⚠️ Risk and Management
Risk/Reward ~1:3.5 (optimal under current volatility).
Avoid adding below $241.00 — zone invalidates below $240.70.
Volume must increase on breakout above $243.40; otherwise, partial exit recommended.
WaverVanir ⚡ To grow and conquer
stocktwits.com/WaverVanir | wavervanir.com | buymeacoffee.com/wavervanir
Not Investment Advice
stocktwits.com/WaverVanir | wavervanir.com | buymeacoffee.com/wavervanir
Not Investment Advice
Disclaimer
The information and publications are not meant to be, and do not constitute, financial, investment, trading, or other types of advice or recommendations supplied or endorsed by TradingView. Read more in the Terms of Use.