JIOFIN Weekly Chart Analysis
JIO Financial is showing strong price action on the weekly timeframe.
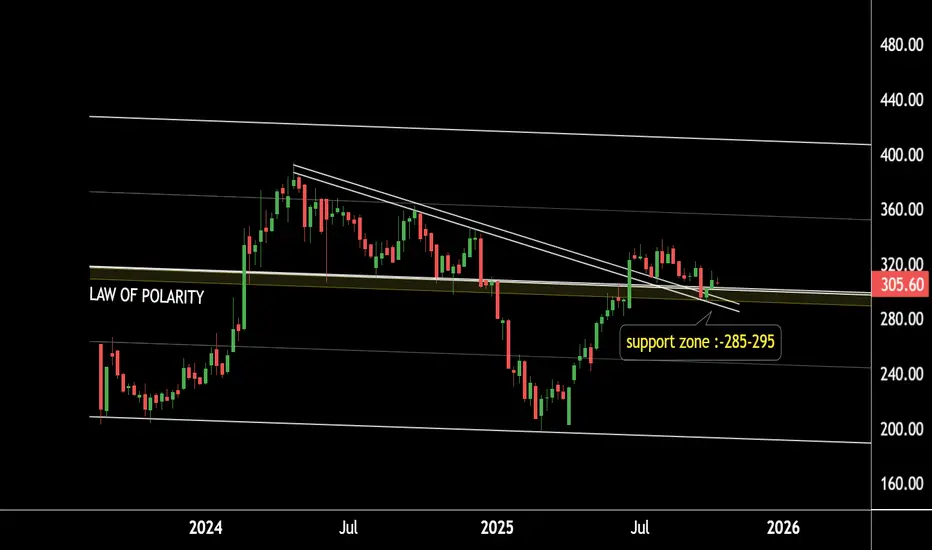
The stock is currently holding above a key law of polarity support zone around the ₹285–₹295 range.
It is also sustaining above its breakout level, with the retesting zone aligning near ₹285–₹300.
If this zone continues to hold, we may witness higher levels in JIOFIN in the coming sessions.
Conclusion:
Holding above 285–300 could trigger the next bullish leg.
JIO Financial is showing strong price action on the weekly timeframe.
The stock is currently holding above a key law of polarity support zone around the ₹285–₹295 range.
It is also sustaining above its breakout level, with the retesting zone aligning near ₹285–₹300.
If this zone continues to hold, we may witness higher levels in JIOFIN in the coming sessions.
Conclusion:
Holding above 285–300 could trigger the next bullish leg.
@RahulSaraoge
Connect us at t.me/stridesadvisory
Connect us at t.me/stridesadvisory
Disclaimer
The information and publications are not meant to be, and do not constitute, financial, investment, trading, or other types of advice or recommendations supplied or endorsed by TradingView. Read more in the Terms of Use.