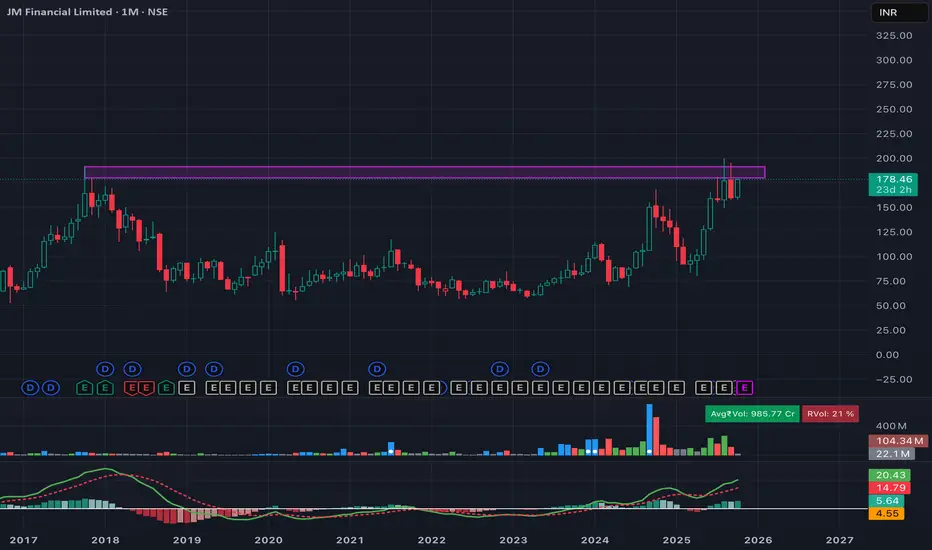
JM Financial is approaching a major breakout zone around ₹200, which has acted as a strong resistance for several years. The stock has built a solid base and is showing renewed momentum with strong monthly candle structure and improving volume.
If it manages to break and sustain above ₹200, it could mark the beginning of a long-term trend expansion phase. MACD is turning positive on higher timeframe — adding to the bullish setup.
📊 Positional Trade Plan
Entry: Above ₹200 (monthly closing or breakout confirmation)
Stop Loss (SL): 10% below entry or as per your risk
Target: 🎯 ₹300 (Long-term positional target)
View: A monthly close above ₹200 can trigger a strong multi-month breakout — ideal for investors with medium-to-long-term outlook.
Disclaimer
The information and publications are not meant to be, and do not constitute, financial, investment, trading, or other types of advice or recommendations supplied or endorsed by TradingView. Read more in the Terms of Use.
Disclaimer
The information and publications are not meant to be, and do not constitute, financial, investment, trading, or other types of advice or recommendations supplied or endorsed by TradingView. Read more in the Terms of Use.