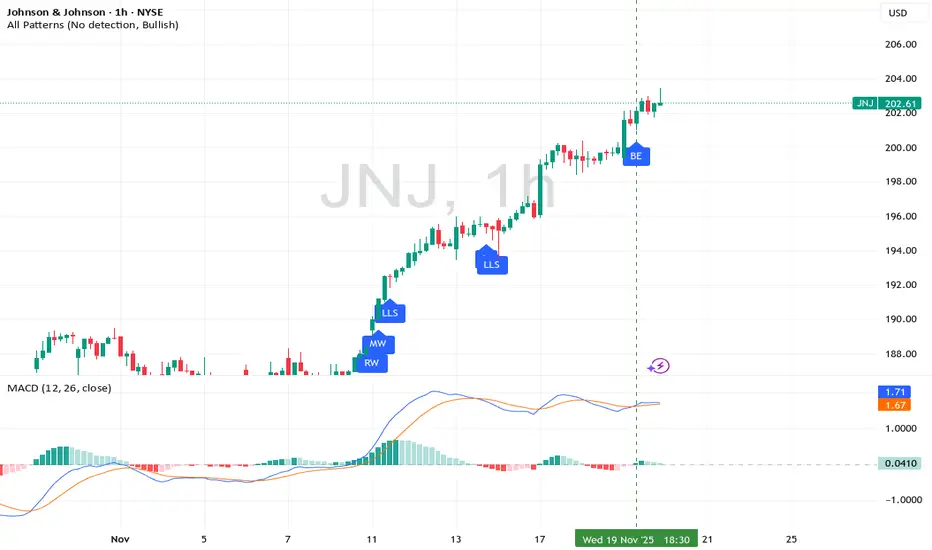
I missed this entry on this stock  JNJ
JNJ
but atleast i got to see the entry.
This entry happen,
On the 1 hour timeframe i looked for a candlestick pattern
to show me the bottom reversal
After seeing the candlestick in this case the
bullish engulfing
Showed me the bottom reversal
then Boom
the MCAD turned
the MACD is the safety net
showing you the confirmation on the
buying chart especially on the 1 hour chart
--
Trade Insight:
This represents a maximum probability bullish continuation setup because:
• All timeframes show maximum bullish momentum (Dark Green MACD)
• Daily shows the strongest bullish pattern (Rising 3 Soldiers)
• 4H & 1H confirm with Bullish Separating Lines (sustained buying pressure)
• Perfect storm of continuation signals across all timeframes
Rocket boost this content to learn more
Disclaimer: Trading is risky
please use a simulation trading account before you
trade with real money
Disclaimer
The information and publications are not meant to be, and do not constitute, financial, investment, trading, or other types of advice or recommendations supplied or endorsed by TradingView. Read more in the Terms of Use.
Disclaimer
The information and publications are not meant to be, and do not constitute, financial, investment, trading, or other types of advice or recommendations supplied or endorsed by TradingView. Read more in the Terms of Use.