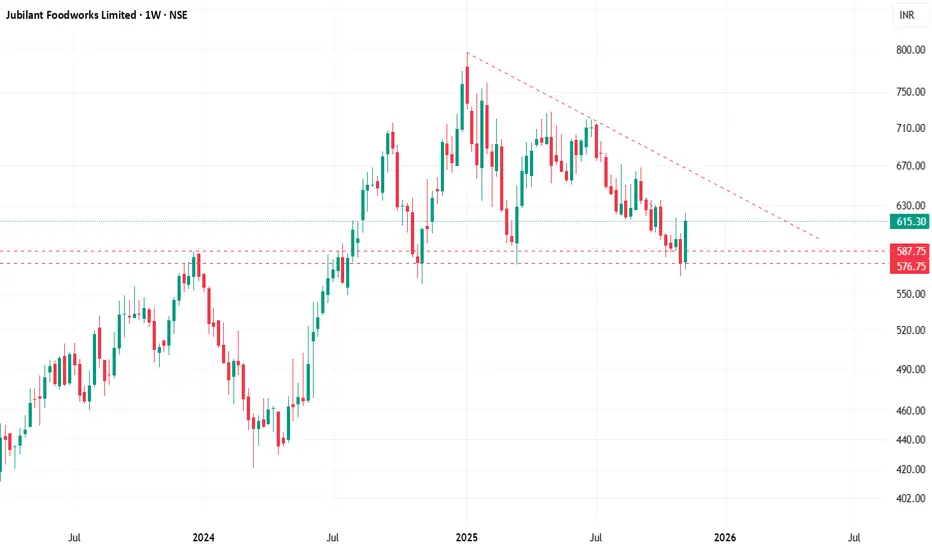
1. Major Trend
The stock has been in a broader downtrend since its peak near ₹780–₹800, forming a clear descending trendline with lower highs.
Recent candles indicate loss of downside momentum, suggesting a possible base formation near the ₹575–₹585 zone.
2. Key Levels
🔹 Support Zone (Demand Zone) – ₹575 to ₹588
The chart highlights two red dotted lines around ₹587.75 and ₹576.75.
This zone has acted as multi-month support where buyers consistently defend.
Price recently rebounded strongly from this zone, forming a bullish weekly candle.
🔹 Immediate Resistance – ₹625–₹630
Price is currently at ₹615, approaching a minor resistance around ₹625/630, which also aligns with horizontal congestion from past candles.
🔹 Major Resistance – Descending Trendline (~₹650–₹670)
The stock must break out above ₹650–₹670 to signal a trend reversal.
This is the key technical barrier stopping the bulls since 2024.
3. Price Action Analysis
A sharp bounce (+6.7% weekly) from major support suggests:
Short-term accumulation
Buyers stepping in aggressively
Weekly candle body shows strong recovery, rejecting lower levels decisively.
4. Indicators / Structural Outlook
Based on visible structure since actual indicators not shown
Multiple touches on the descending trendline indicate:
Supply exhaustion nearing
A possible breakout attempt in coming weeks if volumes support
Supports are holding well → High probability of range-bound movement between:
₹575–₹630 (base)
₹630–₹670 (breakout zone)
5. Trading Outlook
📌 Bullish Scenario
Sustained close above ₹630 → First positive sign
Break and close above ₹670 trendline → Trend reversal confirmation
Targets: ₹720 → ₹760
📌 Bearish Scenario
Breakdown below ₹575 (weekly close)
Opens downside toward ₹545 → ₹520
📌 Neutral / Range-Bound Bias
Until price breaks out of the trendline, expect consolidation between:
₹575 (support)
₹670 (trendline resistance)
6. Summary
Stock is at a critical support zone and showing bounce strength.
Trend still bearish on higher timeframe unless it breaks ₹670.
Watch for:
₹630 → short-term resistance
₹670 → major trend shift zone
A breakout above the descending trendline could signal a medium-term trend reversal.
⚠️ Disclaimer (as requested)
This analysis is for educational and informational purposes only. It is not investment advice. Markets involve risk; consult your financial advisor before making trading or investment decisions.
Disclaimer
The information and publications are not meant to be, and do not constitute, financial, investment, trading, or other types of advice or recommendations supplied or endorsed by TradingView. Read more in the Terms of Use.
Disclaimer
The information and publications are not meant to be, and do not constitute, financial, investment, trading, or other types of advice or recommendations supplied or endorsed by TradingView. Read more in the Terms of Use.