Price Action
The stock is showing signs of a potential recovery after a prolonged downtrend. It has formed a base structure and appears to be consolidating after a period of volatility. The price has recently tested resistance and is now stabilizing at slightly lower levels, which could indicate a potential breakout or further consolidation.
The price action suggests that the stock is consolidating just below resistance, which is typical before a potential continuation of the bullish trend.
Key Levels
Support Zones:
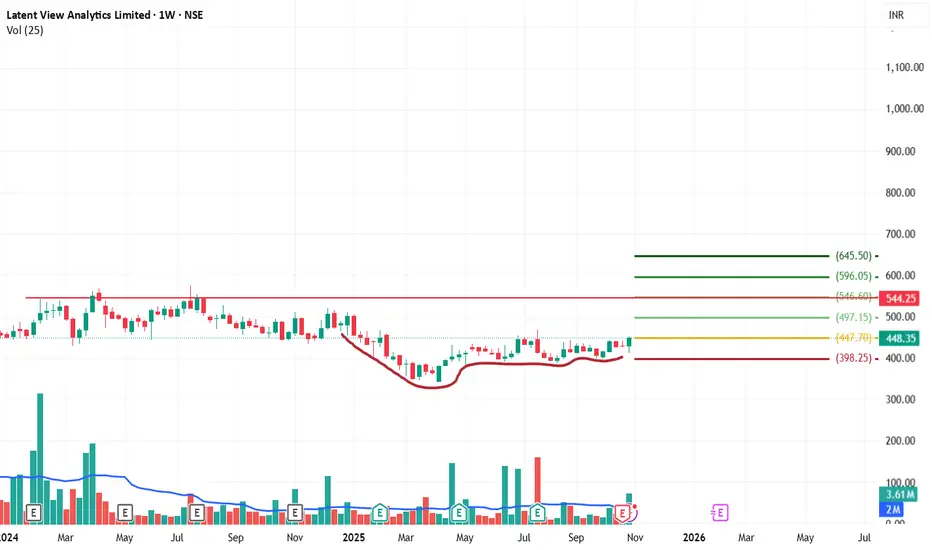
₹398.25 (immediate support).
₹447.70 (stronger support, crucial for maintaining the bullish outlook).
Resistance Zones / Upside Targets:
₹544.25 (minor resistance, likely to face a challenge here).
₹596.05 (key resistance, watch for breakout confirmation).
₹645.50 (higher resistance, major target).
Volume Analysis
Volume has been fluctuating, but the overall trend shows that the stock is not experiencing significant distribution at this point. The volume spikes during periods of higher price action and steady volume during consolidation suggest that the price movement is not driven by panic selling but rather by investor interest in the current range.
Trend & Momentum
Short-term trend: Sideways, with consolidation happening just below resistance.
Medium-term trend: Bullish, as the price is holding above the previous key support levels.
Momentum: Positive, as long as the price remains above ₹447.70, indicating that the bullish sentiment is still intact.
Possible Scenarios
Bullish Case:
A breakout above ₹544.25 could lead the stock toward ₹596.05, followed by a rally to ₹645.50. A strong volume increase would confirm a continuation of the bullish trend and suggest that the stock is ready to move towards the higher targets.
Bearish Case:
If the price fails to hold above ₹447.70 and breaks below ₹398.25, it may retrace further, potentially testing the lower support levels again. A close below ₹398.25 would invalidate the current bullish bias and suggest a deeper correction.
Overall Bias:
The stock is currently consolidating near resistance after a period of downward movement. As long as it holds above the key support level of ₹447.70, the overall bias remains bullish with a potential breakout to the upside towards ₹544.25 and higher targets.
⚠️ Disclaimer: This chart is for educational purposes only.
Regulatory Note: We are an independent development team. Our services are not registered or licensed by any regulatory body in India, the U.S., the U.K., or any global financial authority. Please consult a licensed advisor before making trading decisions.
The stock is showing signs of a potential recovery after a prolonged downtrend. It has formed a base structure and appears to be consolidating after a period of volatility. The price has recently tested resistance and is now stabilizing at slightly lower levels, which could indicate a potential breakout or further consolidation.
The price action suggests that the stock is consolidating just below resistance, which is typical before a potential continuation of the bullish trend.
Key Levels
Support Zones:
₹398.25 (immediate support).
₹447.70 (stronger support, crucial for maintaining the bullish outlook).
Resistance Zones / Upside Targets:
₹544.25 (minor resistance, likely to face a challenge here).
₹596.05 (key resistance, watch for breakout confirmation).
₹645.50 (higher resistance, major target).
Volume Analysis
Volume has been fluctuating, but the overall trend shows that the stock is not experiencing significant distribution at this point. The volume spikes during periods of higher price action and steady volume during consolidation suggest that the price movement is not driven by panic selling but rather by investor interest in the current range.
Trend & Momentum
Short-term trend: Sideways, with consolidation happening just below resistance.
Medium-term trend: Bullish, as the price is holding above the previous key support levels.
Momentum: Positive, as long as the price remains above ₹447.70, indicating that the bullish sentiment is still intact.
Possible Scenarios
Bullish Case:
A breakout above ₹544.25 could lead the stock toward ₹596.05, followed by a rally to ₹645.50. A strong volume increase would confirm a continuation of the bullish trend and suggest that the stock is ready to move towards the higher targets.
Bearish Case:
If the price fails to hold above ₹447.70 and breaks below ₹398.25, it may retrace further, potentially testing the lower support levels again. A close below ₹398.25 would invalidate the current bullish bias and suggest a deeper correction.
Overall Bias:
The stock is currently consolidating near resistance after a period of downward movement. As long as it holds above the key support level of ₹447.70, the overall bias remains bullish with a potential breakout to the upside towards ₹544.25 and higher targets.
⚠️ Disclaimer: This chart is for educational purposes only.
Regulatory Note: We are an independent development team. Our services are not registered or licensed by any regulatory body in India, the U.S., the U.K., or any global financial authority. Please consult a licensed advisor before making trading decisions.
Creator of “VaultSignal Weekly, SignalSurge Daily, ProChart Future Hourly, – Invite-only scripts. Access available via profile. t.me/+Mdc4fo9qxn8zNzI1
Disclaimer
The information and publications are not meant to be, and do not constitute, financial, investment, trading, or other types of advice or recommendations supplied or endorsed by TradingView. Read more in the Terms of Use.