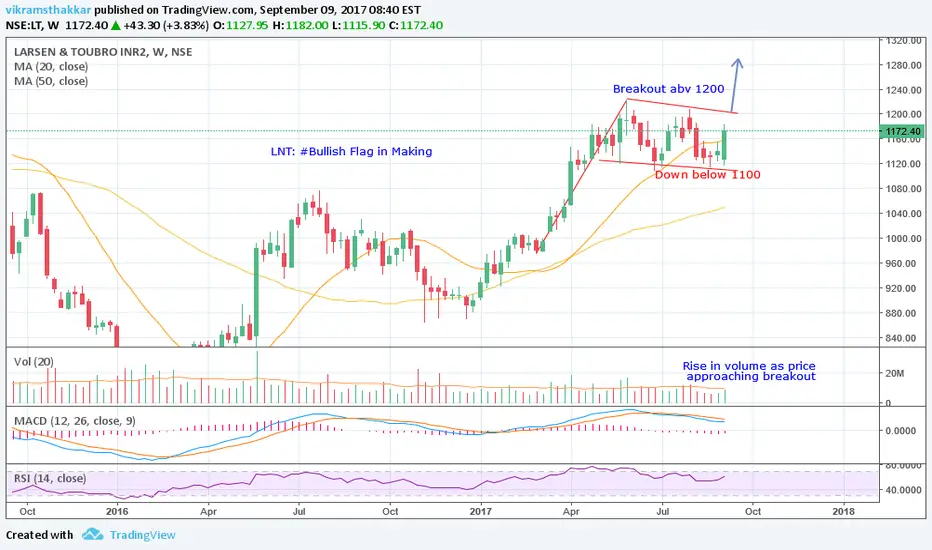
LNT bullish flag in making (Weekly Chart) with breakout on close above 1200
Rise in volume seen as price is moving towards breakout point
Descending triangle visible on Daily chart with best results if breakout on upside
Also price is trading above key moving averages
Rise in volume seen as price is moving towards breakout point
Descending triangle visible on Daily chart with best results if breakout on upside
Also price is trading above key moving averages
Disclaimer
The information and publications are not meant to be, and do not constitute, financial, investment, trading, or other types of advice or recommendations supplied or endorsed by TradingView. Read more in the Terms of Use.
Disclaimer
The information and publications are not meant to be, and do not constitute, financial, investment, trading, or other types of advice or recommendations supplied or endorsed by TradingView. Read more in the Terms of Use.