#LTC/USDT
 LTC weekly chart shows price is at bottom and above lower line of triangle.
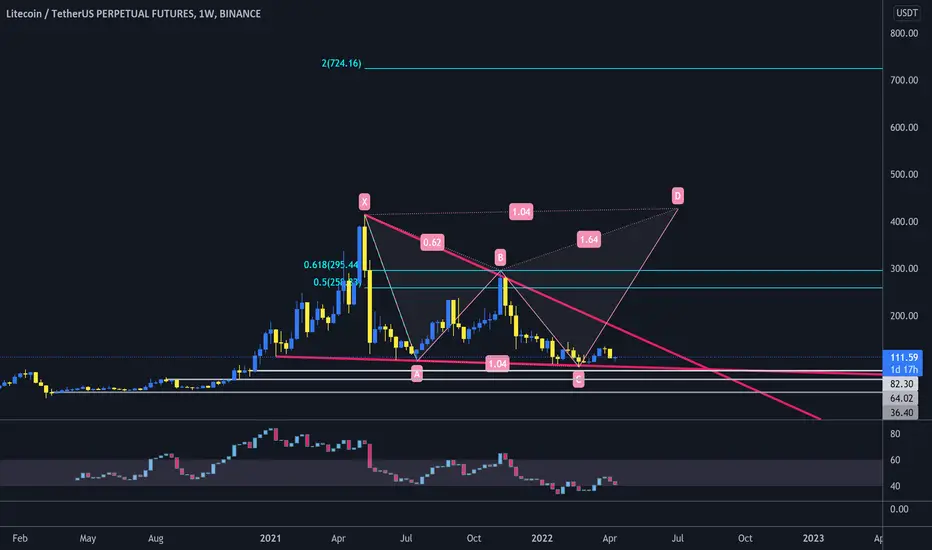
🐮 holding the lower line of triangle as support can increase price toward upper line around $150.
break out from upper line of triangle will confirm double bottom pattern and will head up price toward $400 and $700.
🐻 break down from lower line will drop price to supports shown in chart.
🐮 holding the lower line of triangle as support can increase price toward upper line around $150.
break out from upper line of triangle will confirm double bottom pattern and will head up price toward $400 and $700.
🐻 break down from lower line will drop price to supports shown in chart.
Disclaimer
The information and publications are not meant to be, and do not constitute, financial, investment, trading, or other types of advice or recommendations supplied or endorsed by TradingView. Read more in the Terms of Use.
Disclaimer
The information and publications are not meant to be, and do not constitute, financial, investment, trading, or other types of advice or recommendations supplied or endorsed by TradingView. Read more in the Terms of Use.