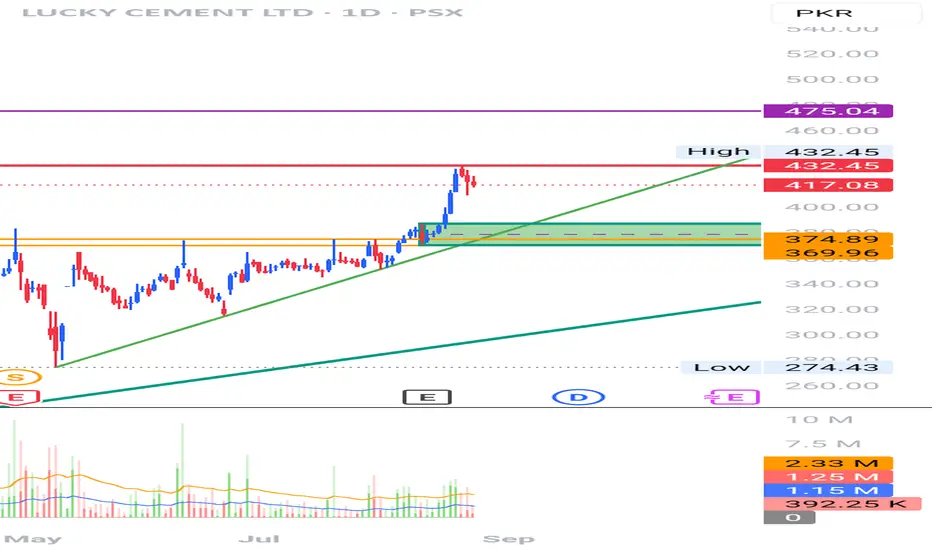
Two Bullish Trendlines at Play.
Light Green is the internal HyperBull aligning with EMA 50
Dark Green is the External Long Term Rising Bull Support aligning with EMA200
All Time High Resistance marked by Redline.
Orange Lines represt the previous Resistance Zone. SnR Flip Zone. Breakout of which gives a measured price target of 475. Structural breakout from a Bullish Triangle, which can be seen by observing Light Green Support Trendline and Orange Horizontal Resistance Zone.
Let's see if Rs.400 holds and provides interim support for the next leg upwards.
Bullish Order Block represented by Green Box/Rectangle is the most relevant long term Buying Zone.
Disclaimer
The information and publications are not meant to be, and do not constitute, financial, investment, trading, or other types of advice or recommendations supplied or endorsed by TradingView. Read more in the Terms of Use.
Disclaimer
The information and publications are not meant to be, and do not constitute, financial, investment, trading, or other types of advice or recommendations supplied or endorsed by TradingView. Read more in the Terms of Use.