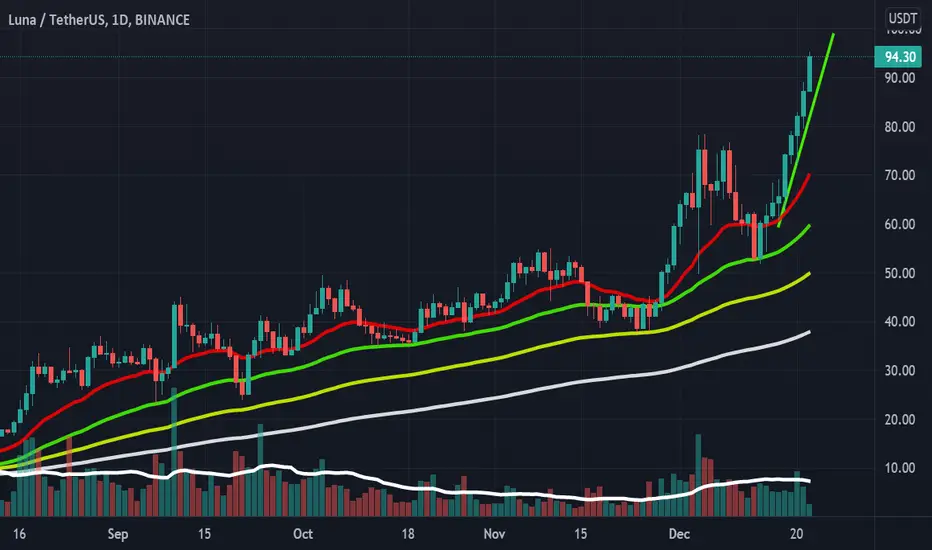
The weekly technical chart of the LUNA coin highlights a strong momentum in price which might push it to a new high. On the daily chart the asset price has been on a continuous bull run. LUNA upside trend might observe a setback near the value of $100. The downtrend might find a support near $80 . The price of the coin is currently trailing above the 50 and 100 Daily Moving Average, with a strong bullish crossover. There are several bullish engulfing patterns in Terra which support the uptrend in price. LUNA/BTC pair may also see a similar gains in the futur
Disclaimer
The information and publications are not meant to be, and do not constitute, financial, investment, trading, or other types of advice or recommendations supplied or endorsed by TradingView. Read more in the Terms of Use.
Disclaimer
The information and publications are not meant to be, and do not constitute, financial, investment, trading, or other types of advice or recommendations supplied or endorsed by TradingView. Read more in the Terms of Use.