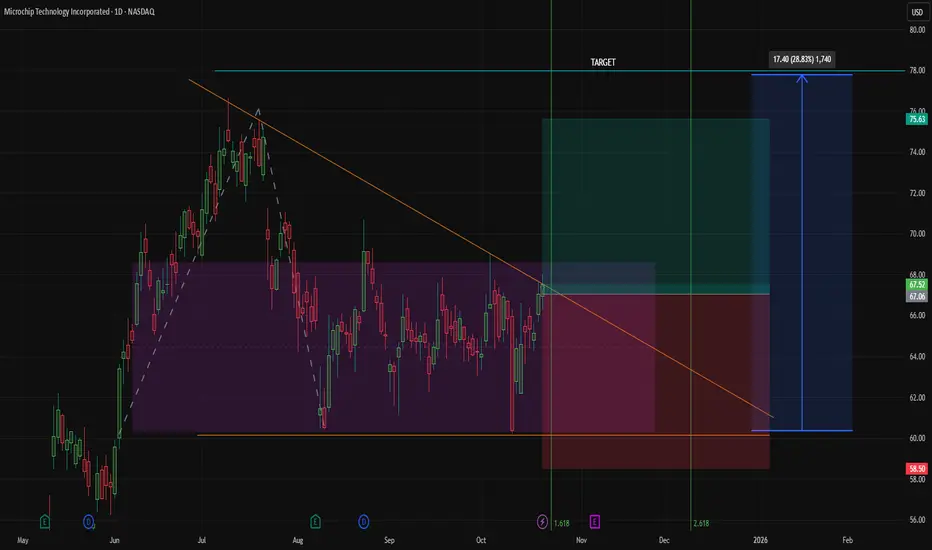
MCHP has been trading in a sideways wedge range between roughly $62/68 since July, forming a descending wedge pattern. The price is approaching a breakout above the upper boundary of this consolidation, near the 1.618 Fibonacci level. It sits slightly above both the 50 and 200 day SMAs, offering dynamic support. Indicators show mild bullish signals: RSI at 57, MACD positive, but Stochastic in overbought territory suggests a possible short-term pullback. Volume shows buying dominance, though overall levels remain low. The recent breach of the descending trendline with a possible confirmation for by October 23th hints at a potential upward move, targeting around $77 , assuming the current momentum continues. Key support lies near $62/63, with immediate resistance around $68/69.
Trade active
The pattern changed to a falling wedge, the goal continue on the table even after falling 7.57% from the previous pattern (triangle) Disclaimer
The information and publications are not meant to be, and do not constitute, financial, investment, trading, or other types of advice or recommendations supplied or endorsed by TradingView. Read more in the Terms of Use.
Disclaimer
The information and publications are not meant to be, and do not constitute, financial, investment, trading, or other types of advice or recommendations supplied or endorsed by TradingView. Read more in the Terms of Use.