Multi Commodity Exchange of India (MCX) is showing strong bullish momentum as it closes in on its all-time high. After a period of healthy consolidation, today's positive price action suggests the stock is preparing to challenge its key resistance level.
The Context: Consolidation Below the Peak
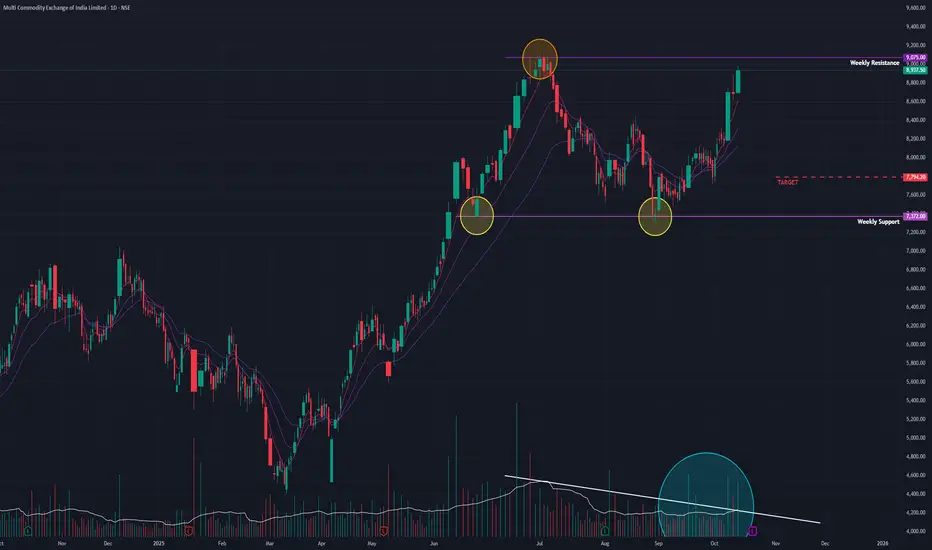
Following a strong bullish uptrend, MCX entered a sideways consolidation phase in June 2025. It registered a new All-Time High (ATH) in July 2025, which established a formidable resistance level that has capped all subsequent rallies.
Today, the stock showed renewed strength with a solid gain of +2.87% on good volume. This move has pushed the price to less than 2% below its ATH resistance, placing it on high alert for an imminent breakout attempt.
Underlying Technical Strength
The potential for a breakout is strongly supported by key technical indicators across multiple timeframes (Monthly, Weekly, and Daily):
- EMA Crossover: The short-term Exponential Moving Averages (EMAs) are in a bullish positive crossover state.
- Rising RSI: The Relative Strength Index (RSI) is rising, confirming that momentum is building.
These indicators suggest a broad-based strength that could fuel a move to new highs.
Outlook and Key Levels
The immediate path for MCX will be determined by its interaction with the ATH resistance.
- Bullish Breakout Scenario: A decisive close above the all-time high on strong volume would confirm a breakout and signal a continuation of the primary uptrend. The next potential target in this scenario would be the ₹10,800 level.
- Potential Pullback Scenario: If the stock fails to breach the resistance and loses momentum, it could pull back to test the lower end of its consolidation range, with the primary support level at ₹7,800.
In conclusion, MCX is coiled for a potentially significant move. The focus in the coming days should be squarely on the price and volume action at the all-time high resistance, as a breakout here would be a major bullish signal.
The Context: Consolidation Below the Peak
Following a strong bullish uptrend, MCX entered a sideways consolidation phase in June 2025. It registered a new All-Time High (ATH) in July 2025, which established a formidable resistance level that has capped all subsequent rallies.
Today, the stock showed renewed strength with a solid gain of +2.87% on good volume. This move has pushed the price to less than 2% below its ATH resistance, placing it on high alert for an imminent breakout attempt.
Underlying Technical Strength
The potential for a breakout is strongly supported by key technical indicators across multiple timeframes (Monthly, Weekly, and Daily):
- EMA Crossover: The short-term Exponential Moving Averages (EMAs) are in a bullish positive crossover state.
- Rising RSI: The Relative Strength Index (RSI) is rising, confirming that momentum is building.
These indicators suggest a broad-based strength that could fuel a move to new highs.
Outlook and Key Levels
The immediate path for MCX will be determined by its interaction with the ATH resistance.
- Bullish Breakout Scenario: A decisive close above the all-time high on strong volume would confirm a breakout and signal a continuation of the primary uptrend. The next potential target in this scenario would be the ₹10,800 level.
- Potential Pullback Scenario: If the stock fails to breach the resistance and loses momentum, it could pull back to test the lower end of its consolidation range, with the primary support level at ₹7,800.
In conclusion, MCX is coiled for a potentially significant move. The focus in the coming days should be squarely on the price and volume action at the all-time high resistance, as a breakout here would be a major bullish signal.
Disclaimer: This analysis is my personal view & for educational purposes only. They shall not be construed as trade or investment advice. Before making any financial decision, it is imperative that you consult with a qualified financial professional.
Disclaimer
The information and publications are not meant to be, and do not constitute, financial, investment, trading, or other types of advice or recommendations supplied or endorsed by TradingView. Read more in the Terms of Use.