Structure
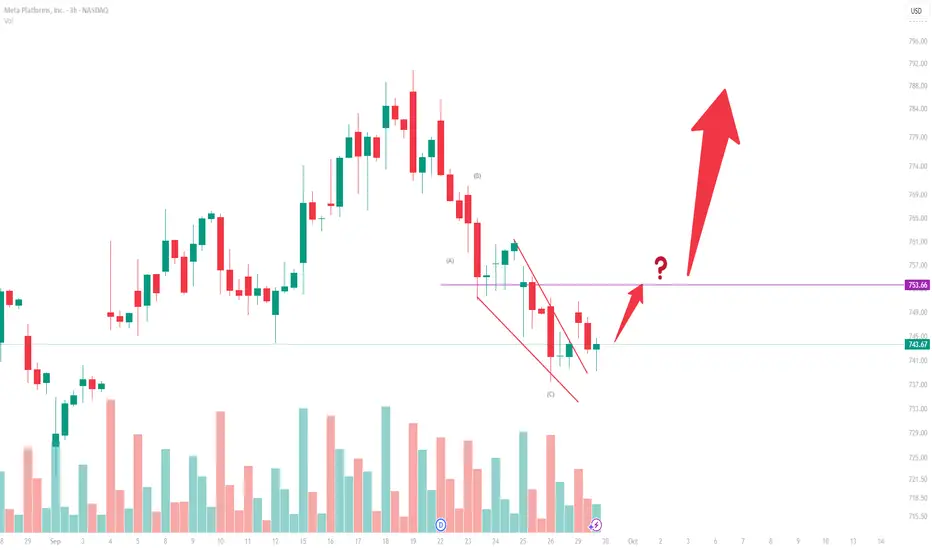
The chart displays a zigzag corrective pattern labeled (A) → (B) → (C).
Wave (C) unfolds inside a falling wedge (ending diagonal), a common terminal structure at the end of corrections.
The breakout attempt from this wedge suggests that Wave (C) may be complete.
Wave (A)
A sharp, impulsive decline in five subwaves.
Defines the start of the correction.
Wave (B)
A three-wave upward retracement.
Retraces roughly 0.38–0.50 of Wave (A), consistent with zigzag proportions.
Wave (C)
A five-wave structure contained within a converging wedge.
Subwave (v) shows diminishing momentum, typical of an ending diagonal.
The upward break through the wedge top signals the potential termination of Wave (C).
Key Level
753.66 is the critical resistance.
A confirmed move above 753.66 validates that the (A)–(B)–(C) correction has ended and a new impulsive sequence may be starting.
Failure to reclaim 753.66 leaves the risk that the bounce is only a temporary rally within a larger correction.
Alternate Scenario
A new low beneath the Wave (C) termination point would invalidate the completion view, implying the correction is extending.
💼 Professional market insights & charts:
cakirinsights.com/
cakirinsights.com/
Disclaimer
The information and publications are not meant to be, and do not constitute, financial, investment, trading, or other types of advice or recommendations supplied or endorsed by TradingView. Read more in the Terms of Use.